CLO Market Trends: September 2022 Edition
Price volatility drives higher trading volumes and primary is up from summer lows.
Guest Speaker: Komal Shahzad, PineBridge Investments
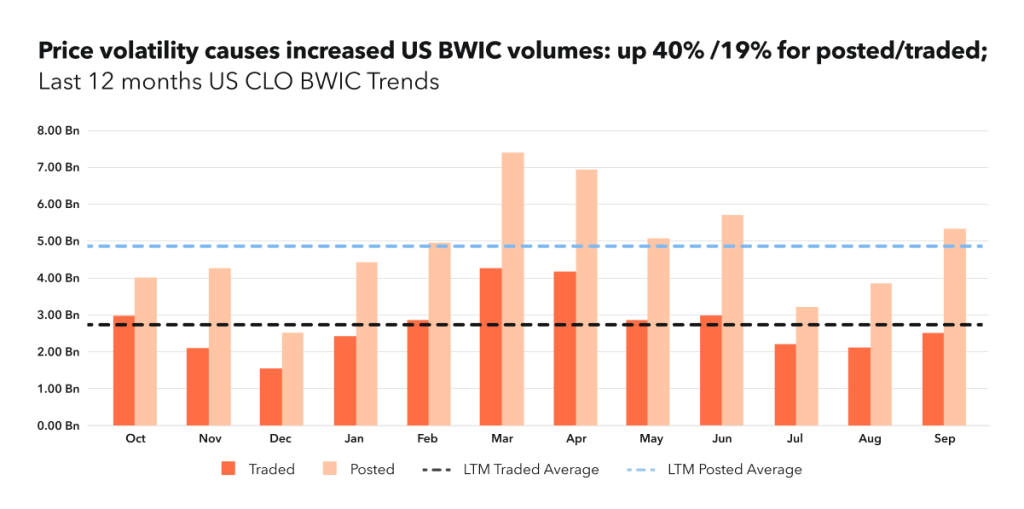
BWIC Volumes
Price volatility accounted for higher BWIC volumes, especially in Europe, where we saw the largest posted volume in 3 years. In the US, year-to-date volume continues to track 48% higher at $26.86BN traded versus $18.10BN in 2021. A UK currency and government bond slump caused pension funds and other institutional investors to sell CLOs to meet margin calls. Many US institutions and banks were happy buying at lower levels.
BWIC Volumes by Rating
BWIC volumes continue to be driven by IG-rated tranches, however this has dropped for the fourth month in a row from 80% to 71% of total traded. This is due to a significant increase in mezzanine activity and a simultaneous drop in AAAs.
“In early September, it was more attractive to buy AAAs in a new issue vs. secondary market. This is why you see the share of AAA trading drop. By the end of the month this dynamic reversed” Komal Shahzad.
TRACE Volumes and DNT Rates
In tandem, TRACE volume is up 40% from August to $16.06BN. Given lower prices, US BWIC DNT rates noticeably rose with AAs peaking at 69%.
“We did not see very motivated sellers at these levels. One nuance: it was a quarter end, and we often see these ‘marking the books’ exercises where investors do not intend to transact” Komal Shahzad.
Dealer’s Inventory
Dealer net flows show banks buying $1.6BN from clients in September which is the largest balance sheet increase in 12 months.
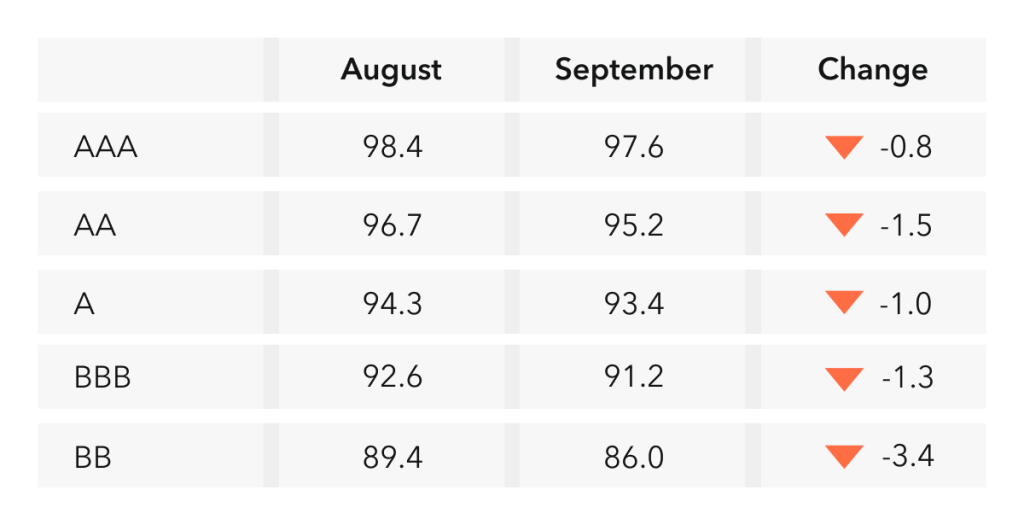
Prices** Across the Stack
Prices are down across the stack with the most noticeable drop in lower mezzanine: BBs were down 3.4 points and BBBs were down 1.3 points. AAs were under pressure as well, with 1.5 point decrease in average trading price.
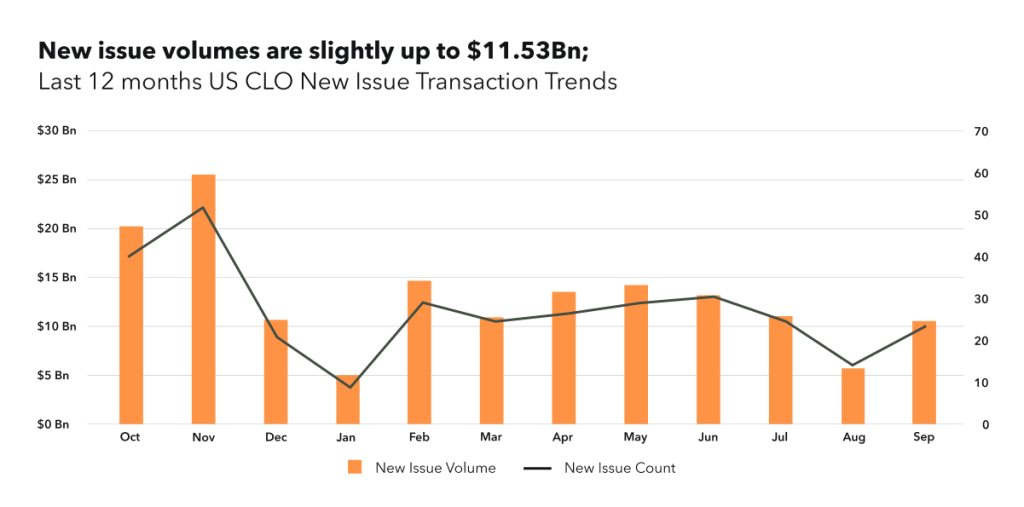
New Issue
New Issue CLO volumes were up from $7.75BN in August to $11.53BN in September. The market is still challenged with US banks not being a significant buyer of AAAs. New issue was dominated by transactions with longer reinvestment period (>3.5yrs) and AAA spreads tightened slightly to 190 – 245bps, from the August highs. In secondary, both long and short dated AAA DMs increased in tandem and the spread curve is still inverted by 3.85 bps.
“Because longer duration AAAs are more discounted in price terms, they trade at tighter spreads than shorter profiles, resulting in an inversion in the duration curve.” Komal Shahzad.
K-Indicator
K-indicator, Kopentech’s measure of market stress deepened further in the negative territory at the end of September. As a reminder, K-indicator is comprised of 5 factors of equal measurement and a reading below zero corresponds to unfavorable conditions. Factors are: 1) price talk deviation from color; 2) DNT levels (demand); 3) Color % in BWIC (transparency); 4 Same Day BWIC (Stability); and 5 price talk deviation from color (liquidity).
Get up to the minute data on CLO new issue and secondary BWIC trading by signing up at kopentech.com
Please join us on November 8th for Market Trends Webinar and register here.
KopenTech is affiliated with KopenTech Capital Markets, a member of FINRA.