CLO Secondary Market Trends: July 2020 Edition
BWIC Volumes:
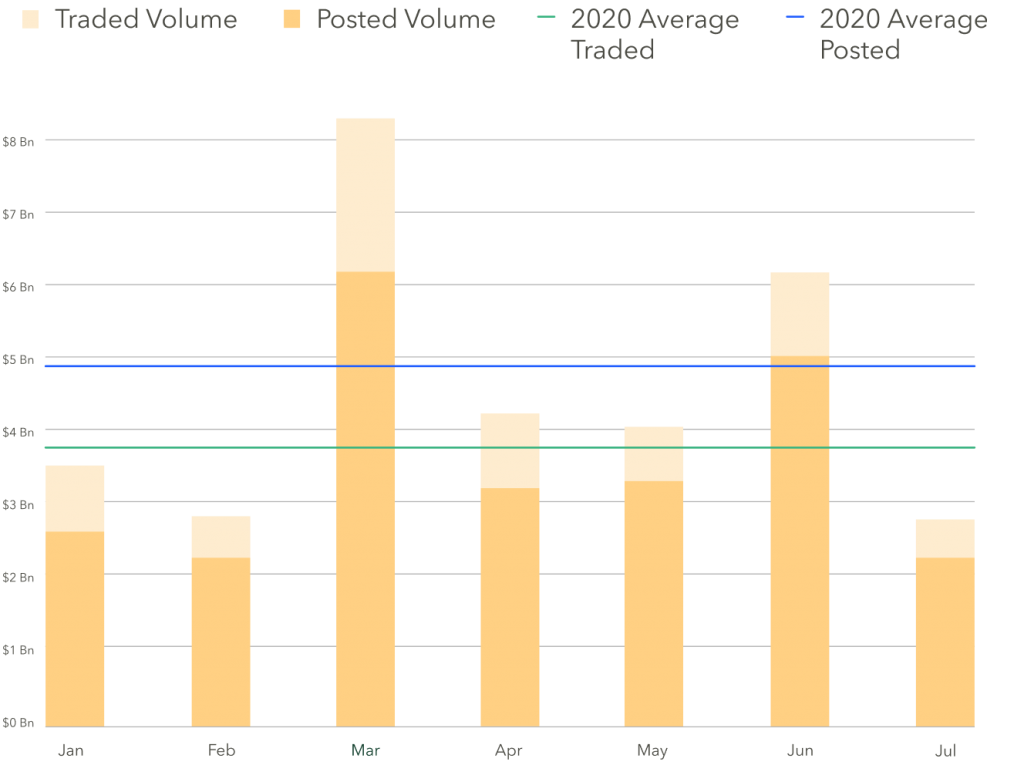
After three months of increased trading activity to begin the COVID era, BWIC volumes dropped to pre-pandemic levels: $2.34/2.87 Bn traded/posted.
US CLO BWIC Trends, 2020:
TRACE Volumes:
TRACE reports show July having the lowest CLO/CDO volumes of 2020, with only $12.8 Bn traded. This is largely attributed to a typical summer slowdown.
BWIC volumes lowest on Fridays
Daily volumes were consistent Monday-Thursday across the capital stack, at ~$150 mm. Friday’s volumes dropped off 90% to ~$18 mm, likely due to long summer weekends.
Dealers sold $1 Bn of Covid Inventory, net $651 mm in July
A decrease in DNT rates suggests there is a strong client demand taking dealers out of their inventory.
BWIC as % of TRACE
Historically, ~1/3 of the TRACE reported volume comes from BWICs. We saw the lowest IG% since January at 24%, and the highest HY% in June and July at 31%. This points to further market stabilization where investors are comfortable to sell less liquid securities via a competitive process.
BWIC Volumes by Tranche
AAA and AA IG volumes were down 50% from their 2020 averages. Meanwhile, HY is steady and CLO equity trading nearly doubled the monthly average in July.
Equity ticket size increased
The average traded equity tranche size skyrocketed by 62.3% in July ($7.60 mm compared with the 2020 average of $2.68 mm). This oddity is explained by 5 majority positions being traded in equity, indicating that older vintages may be in high demand as a source of functioning arbitrage.
Pro Tip: KopenTech heatmap helps you decide the best time to schedule BWICs.
DNT Rates
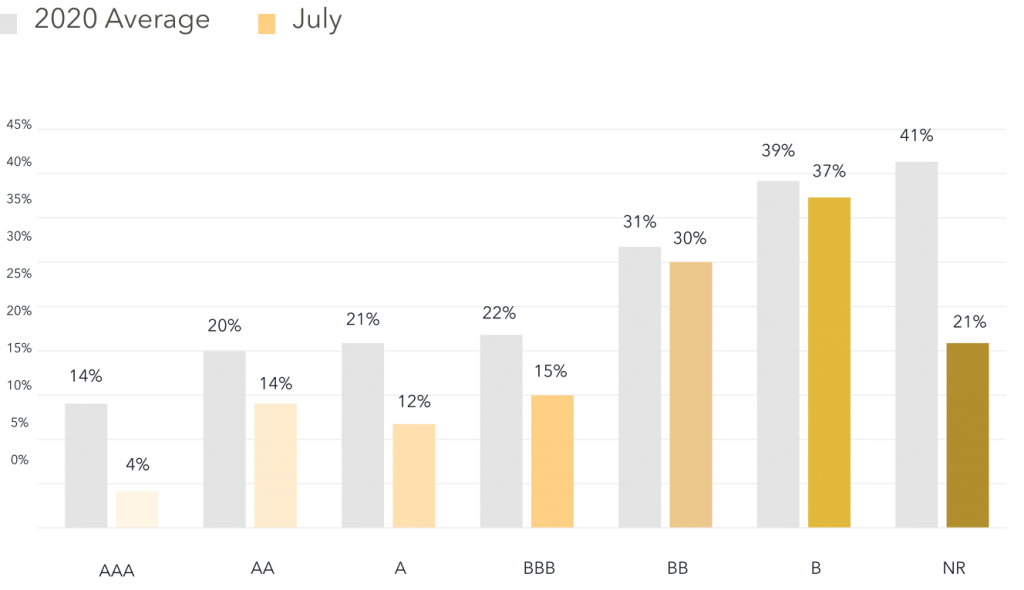
Lower DNT rates indicate high demand relative to supply, and vice-versa. We saw low DNT rates across the stack in July, especially in AAAs and equity, pointing to more buyers than sellers in the market.
July CLO BWIC DNT% by Rating (US)
Biggest Trade
Pretium Crown Point CLO III had a $66.8mm original/$35.9mm current position of AAAs trade in July. In March, $92.3/72.7 mm traded, which is the largest trade in 2020 thus far. The average trade size for AAAs in 2020 is $5.5 mm.
Price Snapshot
Observed color levels showed a slight rise in price in AAA and AA tranches from June to July. A and BBB tranches showed lower prices, possibly as a reflection that lower quality paper was for sale in July.
KopenTech BWIC
Monitor CLO market analysis easier than ever before. Live bidding, and over 6 years of historical CLO data, in a single web-based platform.
*Prices are based trades that provided color (usually second highest bid) and are likely to underestimate actual traded levels