CLO Secondary Market Trends: September 2020 Edition
BWIC Volumes:
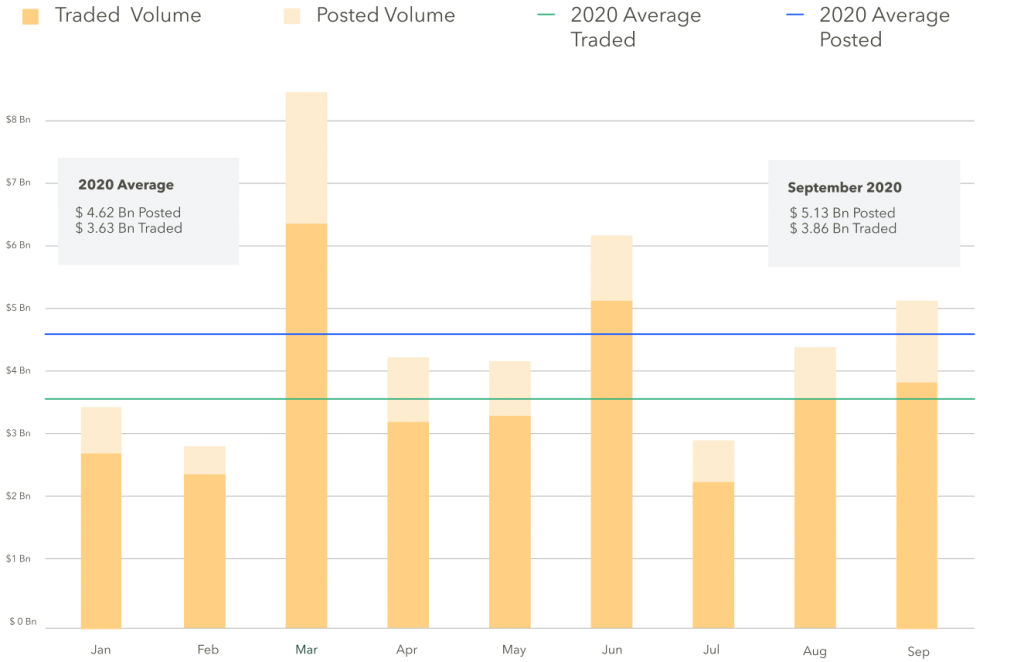
September had the third-largest monthly BWIC volume in 2020 with a steady increase from July’s lull.
US CLO BWIC Trends, 2020:
TRACE Volumes
TRACE reports all CLO trades involving FINRA members, including those done outside of BWICs. TRACE data reports that September CLO trading activity was the lowest of 2020, with $12.0 Bn traded. Additionally, IG BWICs accounted for 40% of TRACE volume, the highest level of the year, up 9% from the 2015-2019 average.
Dealers were positive in September
September saw a modest positive net dealer flow of $83 mm. This correlates with a stronger market, which might have given banks the confidence to expand their balance sheets. September’s activity brings the 2020 cumulative position to roughly neutral.
BWIC Volumes by Tranche: High AAA and equity trading activity
AAA volumes were 28% higher than 2020’s average. At the lower end of the stack, $160 mm of CLO equity traded, a 45% increase versus the average.
Pro Tip: CLO market health barometers are available on the platform in realtime
Average Traded tranche sizes down across the stack
This month was characterized by smaller trade sizes across the stack. All BWIC trade sizes were below 2020’s average, with the average trade size across the stack at $3.2 mm.
DNT Rates
DNT rates can proxy for demand. We saw lower rates/higher demand across the IG stack and equity, and increases/lower demand in BBB, BB and B/CCC.
Trades of the month
Most frequent names on BWIC were Octagon’s 2017 and 2019 vintages, GSO/Blackstone’s Tryton Park CLO and CSAM’s Atrium XIII. Both Octagon deals showed up 5 times while the others showed up 4 on BWIC. The largest trade in September was Palmer Square 2020-1, which had a $54 mm position, 9 times the average AAA notional value.
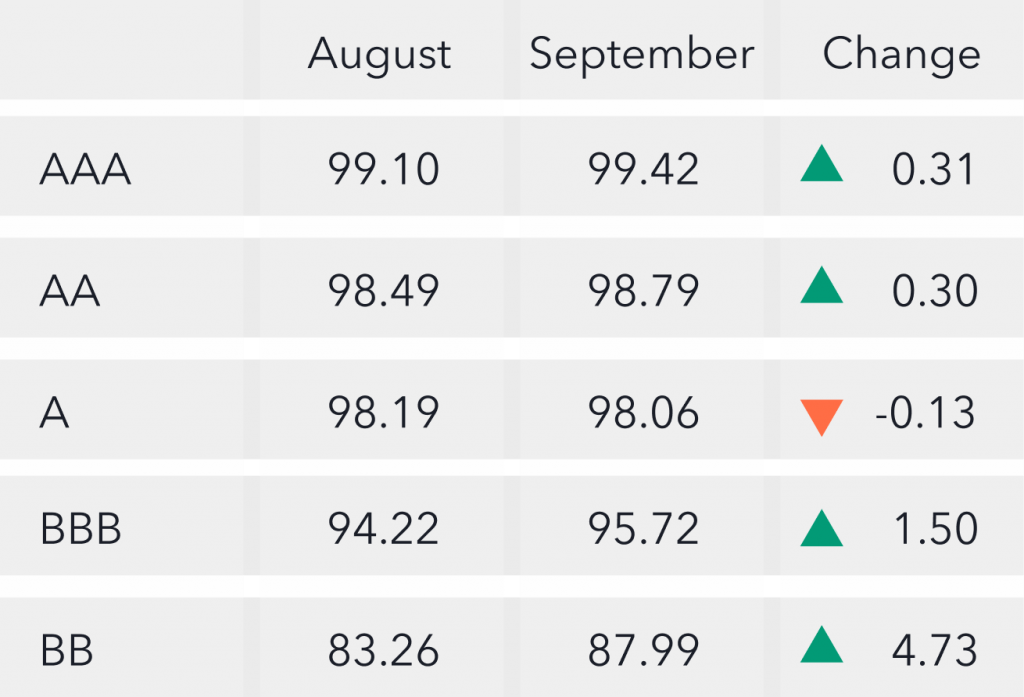
CLO prices* rise across the stack
From August to September we saw overall average prices rise, particularly in BBB and BBs. BB prices increased nearly 5 points.
Intra-month Trend: Liquidity
September was a volatile month. Liquidity trended downward during the second half of the month. DNT rates increased and price talk became inaccurate. When the market is stressed, dislocations and liquidity premia emerge, and price talk accuracy gets reduced. DNT rates started low around 13% and rose to 24% by the end of the month. The percent of BWICs that gave price color started out in the high 60s and declined to less than half of that at the end of the month. Average price talk deviation from color price was low at the beginning of the month, at less than 0.1% and increased to above 0.5% by the end of the month, indicating more stress.
*Prices are based trades that provided color (usually second highest bid) and are likely to underestimate actual traded levels