KopenTech Introduces K-Indicator for CLO Market Stress Analysis
Author: Kamilla Igibayeva
Summary
KopenTech has developed the K-Indicator, a multifactor measure designed to enhance monitoring of secondary CLO market conditions. This tool combines five key factors: Did-Not-Trade (DNT) rate, color rate, same-day BWIC rate, AAA average traded price level, and AAA average price talk deviation from color. Derived from analyzing CLO BWIC volumes and the most granular CUSIP level pricing data available, this methodology standardizes and combines these factors to provide a weekly market stress indicator, offering a valuable single measure that summarizes market conditions.
Background and Market Context
Despite its growth to $1 trillion, the secondary CLO market has historically struggled with opaque and hard-to-obtain data. KopenTech’s K-Indicator addresses this gap by offering a more transparent and informed market view. This tool is particularly valuable in volatile conditions, such as the high-profile bank failures in March 2023.
K-Indicator Factors Explained
- DNT Rate: Measures market demand by comparing traded securities against those tagged as Did-Not-Trade, indicating securities listed for auction but not traded due to bids not meeting the seller’s target level. A rise in DNT % typically signals increased market stress.
- Color Rate: Indicates market transparency, determined by comparing trades with and without provided price information. Reluctance to post prices during stress periods can lead to lower trading levels.
- Same Day BWIC Rate: Reflects market stability, based on the timing of bond sales announcements versus actual trades. Same day BWICs, often linked to forced selling, limit bidders’ analysis time.
- AAA Average Traded Price Level: Serves as a proxy for market strength. AAA securities usually trade around par; trading below par in the secondary market can indicate a cash-raising trend among market participants.
- AAA Average Price Talk Deviation from Color (PTDC): Measures market liquidity, reflecting broker-dealer price talk accuracy. A larger difference between price talk and color suggests heightened market stress and rapid market movement.
Analysis and Insights
To delve into the specifics, the K-Indicator employs a dynamic scale, categorizing values into ‘poor,’ ‘fair,’ ‘good,’ and ‘excellent’ based on their relation to the previous 20 weeks. Visual representations, showcase the K-Indicator’s performance from February 2020 to December 2023, providing investors with a clear and insightful view of market conditions.
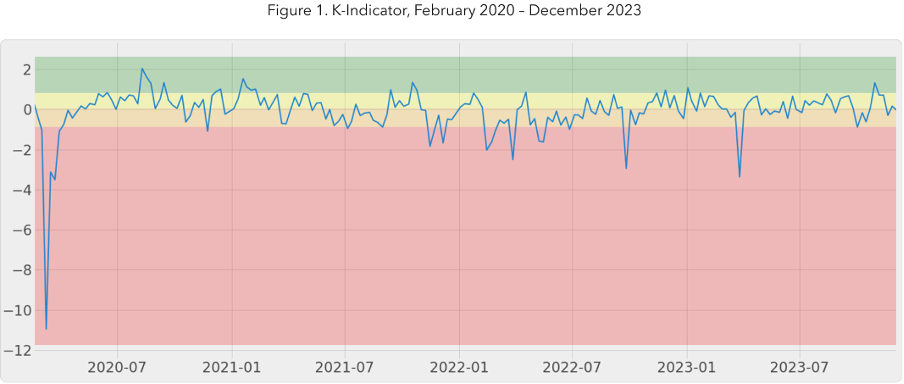
Applied to U.S. BWIC data from October 2019 to December 2023, the K-Indicator effectively identified periods of market stress, including the COVID-19 pandemic in 2020 and the bank failures in March 2023.
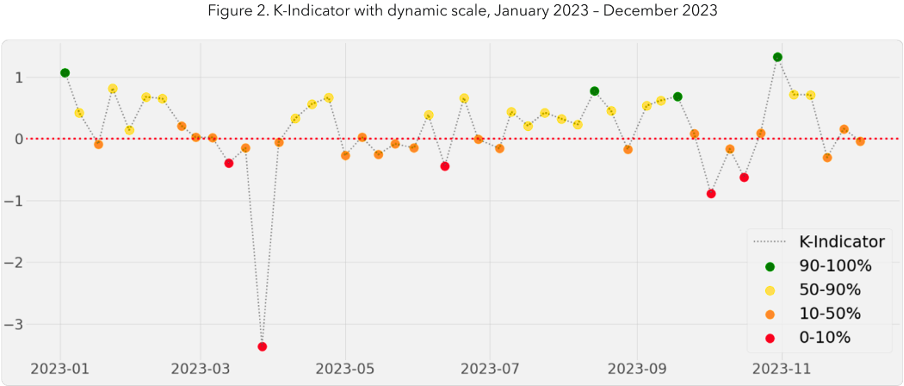
K-Indicator’s dynamic scale version further enhancing analytical capabilities. This dynamic approach allows for a rolling comparison of values over the previous 20 weeks, providing a nuanced understanding of market changes. Red, orange, yellow, and green coloring remains consistent, aiding investors in identifying potential market stress with a focus on recent history.
K-Indicator weekly updates provide a standardized metric to track and compare market stress levels. The K-Indicator marks a significant advancement in understanding the secondary CLO market, helping investors make more informed decisions by analyzing a range of market factors. We invite you to sign up on the platform to track this important measure in real time.