CLO Secondary Market Trends: November 2020 Edition
BWIC Volumes:
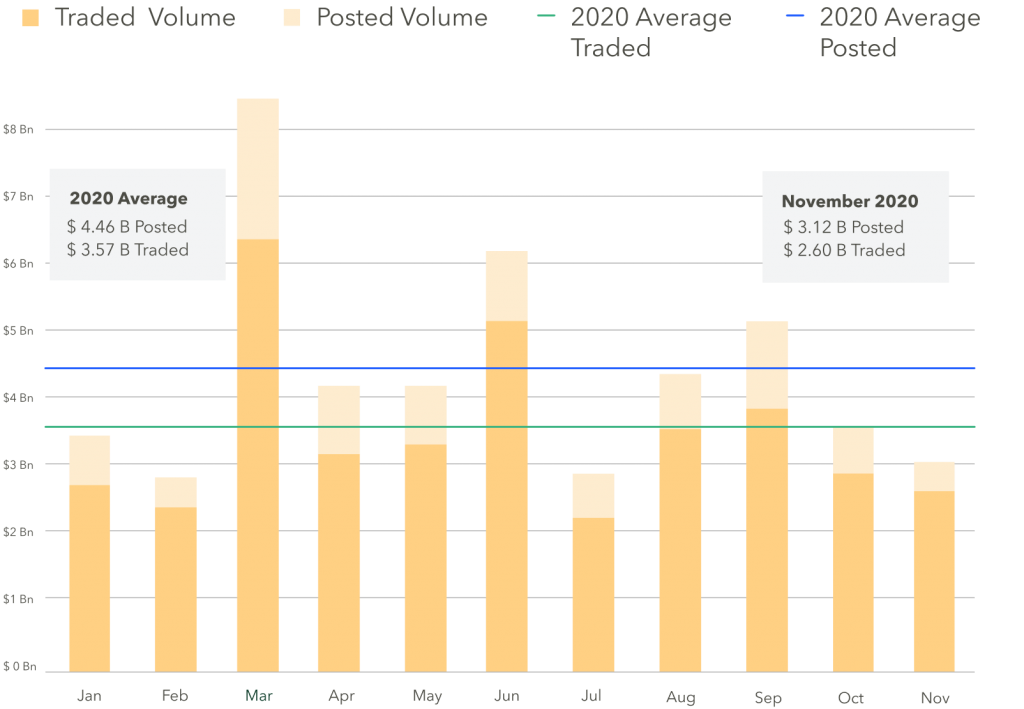
November was the 3rd slowest month of 2020 for BWIC trading as focus has shifted to primary.
US CLO BWIC Trends, 2020:
TRACE Volumes
TRACE reports all CLO trades involving FINRA members, including those done outside of BWICs. TRACE data reports that November CLO trading activity was the second lowest of 2020, with $11.9 B traded.
Positive dealer flow trend continues in November
The last three months saw positive net dealer flow, bringing dealer balance sheets to $332 MM from $196 MM in October. Historically, this correlates with an expectation for a stronger market. Continued dealer purchases might indicate the current rally has room to continue.
Competitive IG and HY trading decreased in November
Both IG and HY BWICs decreased as a percentage of TRACE reported volume. IG bonds typically have a strong representation on BWICs, but dropped to 29% of total TRACE volume, while HY dropped to 11%.
Average BWIC volumes down across the stack
November was characterized by lower trading volumes, both by tranche and by traded size. The most notable volume drop was in CLO equity, which traded at just half the average size in 2020.
DNT Rates
We look to DNT% as a proxy for demand. AAA bonds were in high demand at 3%, down from 2020’s 11% average. CLO equity was also in high demand in November with 14% DNT, down from 35%. Only lower tier IG paper (A and BBB) had higher DNT rates than 2020’s average, albeit only slightly.
Trade of the month
November’s largest BWIC trade was a $75 MM ICG 2017 AAA bond. The average AAA trade size in November was $5.7 MM.
Pro Tip: Monitor CLO market health barometers daily on the Dashboard
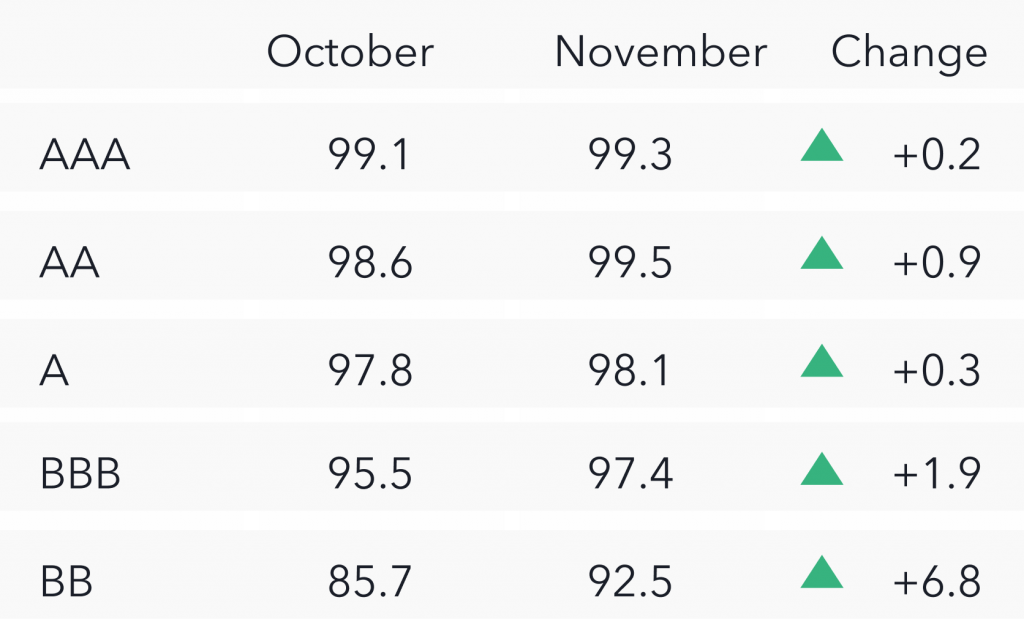
Prices* up across the stack
Color is a proxy for actual traded price. From October to November we saw average prices increase across the stack, including strong improvements in BBB and BB at 1.9 points and 6.8 points respectively.
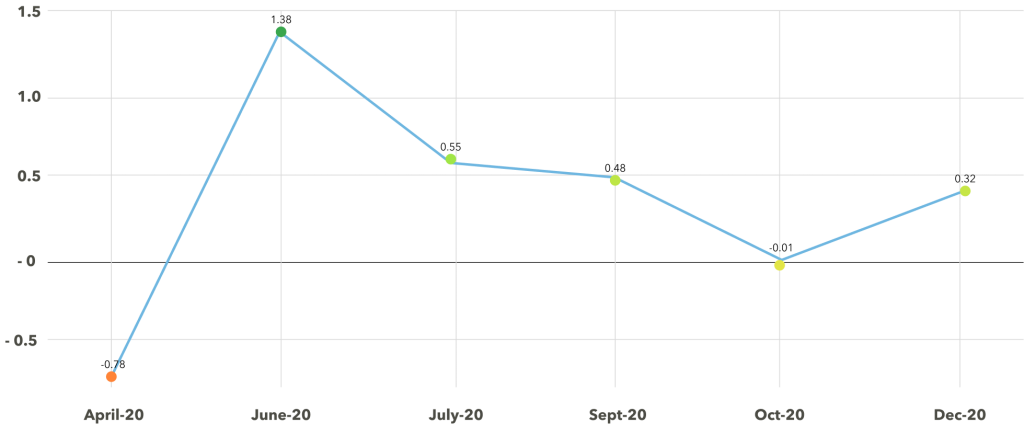
K-Indicator: CLO Market Barometer
K-Indicator is a measure that calculates stress and liquidity in the CLO market using 5 market barometers. Negative figures indicate high stress and low liquidity, and positive figures indicate low stress and high liquidity. The 5 barometers are: DNT% , Color%, Same day BWIC Rate, Px Talk Deviation from Color, and AAA spread levels. The barometer read -0.35 in November, suggesting slightly illiquid conditions in the market.
CLO Market Stress Indicator
*Prices are based on trades that provided color (usually second highest bid) and are likely to underestimate actual traded levels