Introducing Barometers of CLO Secondary Liquidity
Introducing Barometers of CLO Secondary Liquidity Global markets have been turbulent during 2020 and the CLO market was no exception. In fact, the fallout from the coronavirus pandemic has been compared to historic market downturns such as the Great Depression and the Great Financial Crisis of 2007-2008. However, this comparison highlights one striking difference between the CLO market and the markets for virtually all other asset classes: the amount of available secondary trading data and historical trends. Most publicly traded securities like equities and bonds have a deep history of rich data coming from exchanges. CLOs, along with other structured products, are relatively new. Even though CLOs started trading in the early 2000s, the activity picked up with the 2.0 transactions after 2008 when the structures became more standardized. Factor in a market structure where most transactions occur over-the-counter (OTC) and outside of BWICs (out of competition) and it becomes clear that there is little historical data on CLO liquidity trends.
KopenTech is aiming to solve the problem and create indicators of CLO market health. We were able to establish and identify a variety of metrics that help describe the state of the CLO market at a given time by studying how they responded to the market stress this spring and subsequent recovery in the summer. The metrics that were found to be most indicative of market health are defined as follows:
DNT% – Did-Not-Trade (DNT) is a widely used acronym by sellers to indicate to the market that no trade was executed. DNT% is the percentage of bonds that are sent out on a BWIC and tagged ‘DNT’. The higher the value, the less implied liquidity exists in the market. Historically, this rate has been 15-20% for the CLO market, with higher rates for HY bonds and lower rates for IG bonds. For reference, during the March Covid-19 Selloff, this percentage reached 28%.
Color% – The Color% represents the percentage of BWIC trades where price information is provided in the post-trade color. It can be used as a measure of market transparency, with higher values indicating more transparency.
Same Day BWIC% – The Same Day BWIC% is the percentage of bonds that were announced for sale to investors and traded on the same day via BWIC. Most BWICs are announced 48 hours prior to allow bidders enough time to research the listed bonds. It can be used as more of an abstract measure of market sentiment, with a higher value indicating more stress as sellers attempt to rapidly offload positions.
Average Price Talk Deviation from Color (PTDC) – is a measure of aggregate broker-dealer Price Talk accuracy. For each trade where color is provided, we find the absolute error between the actual color price and the average Price Talk value across dealers. The higher the value, the less accurate dealers are in predicting actual prices at that point in time. We use a subsample of AAA bonds only because this metric varies greatly across ratings and AAAs provide the most complete dataset as they represent an overwhelming share of trade volume.
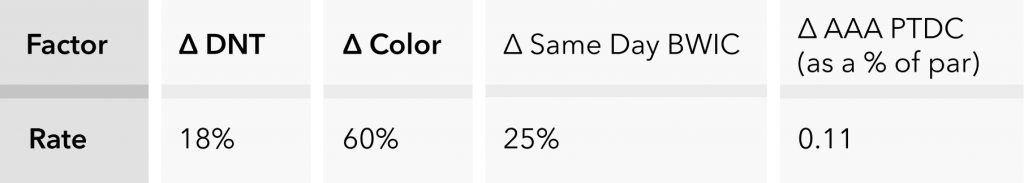
Looking back on 2020, these factors help tell the story of the CLO secondary market for the year. January was relatively calm, so it can serve as a base case:
January Liquidity Factors-Base Case
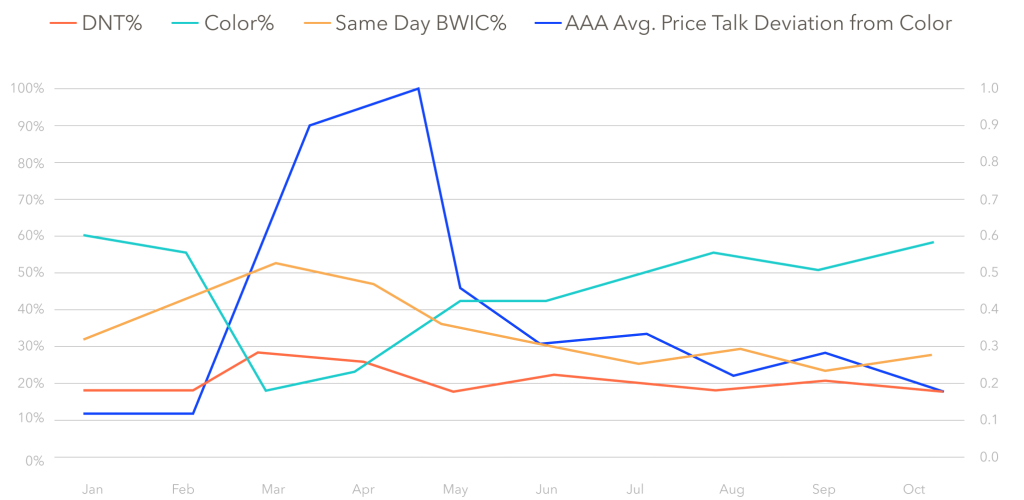
In February, most metrics remained roughly the same. However, the Same Day BWIC% shot up from 25% to 40%. This rise may have been an early clue that market participants were becoming increasingly stressed as more information about COVID-19 became available.
CLO Secondary Liquidity Factors, 2020
March Liquidity Factors – Market Disruption
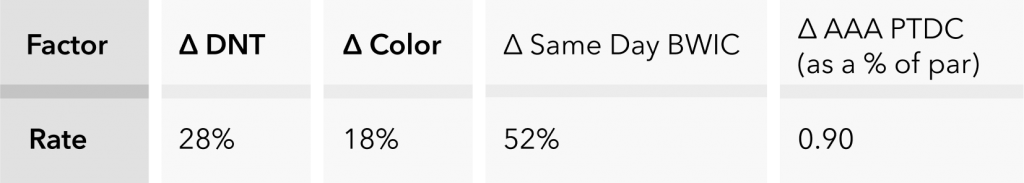
Within a matter of weeks, the market had been flipped on its head; over a quarter of bonds failed to trade, little color was provided, over half of bonds were same-day BWICs, and the average error on AAA Price Talk increased by 800%.
The market remained chaotic in April, but it began trending back to normalcy in May and continued that trajectory ever since. As of October 22, 2020, all four of these indicators have reverted near their January levels. The only metric that seems to be a bit different than the beginning of this year is AAA PTDC at 0.20, but this may just demonstrate that there is currently more disagreement over scenario assumptions than there was pre-pandemic.
As these factors help paint a picture of the 2020 market progression, analyzing how they interact with each other can also help give us a better picture of market mechanics. When looking at how month-over-month changes are correlated between the factors, we see that many effects occur in pairs. In fact, all factors show at least one strong correlation with another. Although correlation does not automatically imply causation, finding out which factors move in tandem is important in understanding their behaviors. To get correlations between factors, we use data from February through September.
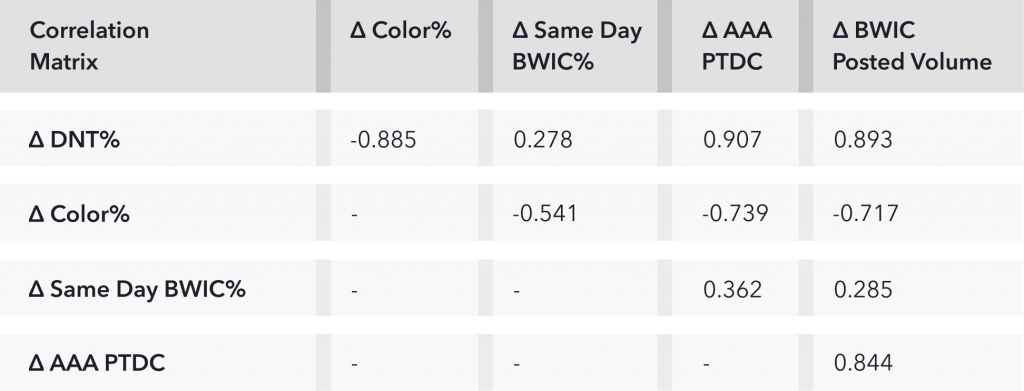
The DNT% is negatively correlated with the Color% and positively correlated with AAA PTDC. These results imply that low market transparency goes hand in hand with poor liquidity, and vice versa. One interpretation is that because liquidity falters in times of uncertainty, information simultaneously becomes more valuable to investors, thus making them less likely to be willing to “show their hand” with regards to price levels.
Color% is negatively correlated with AAA PTDC, showing that market transparency decreases at the same time as dealer inaccuracy rises. This result could imply that dealer predictions become more inaccurate as transparency goes down because unless a dealer is actively purchasing securities in an opaque market, recent comparable prices are hard to come by.
We also investigated correlations between changes in the four factors and changes in BWIC Posted Volumes (including DNT’d bonds). All except the Same Day BWIC% were strongly correlated. These results imply that an influx of market activity exacerbates all of the frictional and transparency issues outlined above.
Given how these factors behaved over the course of 2020 as well as their relationships with market volume, we believe they create a substantial barometer for CLO secondary market health. Simply put, they all represent some facet of market friction. These frictions hurt everyone in the secondary market – sellers find it hard to trade, dealers suffer price mismatches, and the market becomes debilitated under stress. A better centralized marketplace would improve the CLO trading process for all parties and provide the market with the best data possible.