CLO Secondary Market Trends: September 2021 Edition
BWIC Volumes
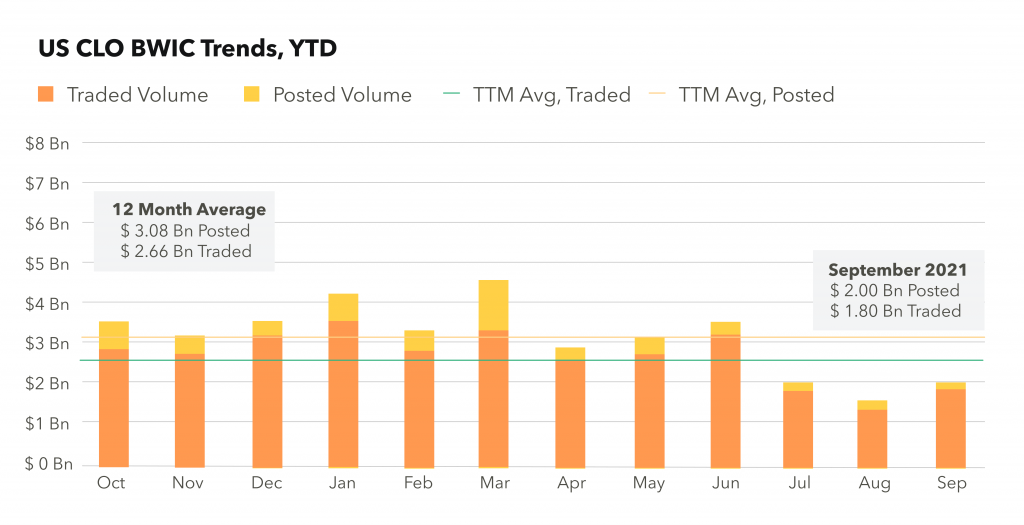
September BWIC volumes were muted, with posted BWICs totaling just over $2.0 Bn and traded at $1.8 Bn. Posted and traded volumes continue in close tandem, with over 90% of posted BWICs trading during September. This trend is a good indicator of demand and a positive for the CLO market liquidity.
TRACE* Volumes
Reported CLO trading volumes jumped to $14 Bn in September, a sharp $5.5 Bn increase over August. The increase was attributed to the non-IG volume, which was the largest YTD.
BWICs as % of TRACE
$1 Bn daily TRACE volume is a rare occurrence. An average month has 1 to 3 days with over $1 Bn in trades. September 22 saw over $6 Bn in non-IG trades reported to TRACE- a sharp outlier. Due to such volume, only 6% of non-IG securities traded via BWICs in August, while IG bonds returned to a longer-term average of 29% in September.
BWIC Volumes By Rating
Only half of the typical AAA volume traded; $550 million of AAA securities were sold via BWIC compared to the trailing 12-month average of $1.1 Bn. Similar drops in volumes were seen across the capital stack, with $220 million of AAs trading on BWIC. CLO equity, on the other hand, was slightly higher than its trailing 12-month average with $240 million trading via BWICs.
DNT Rates
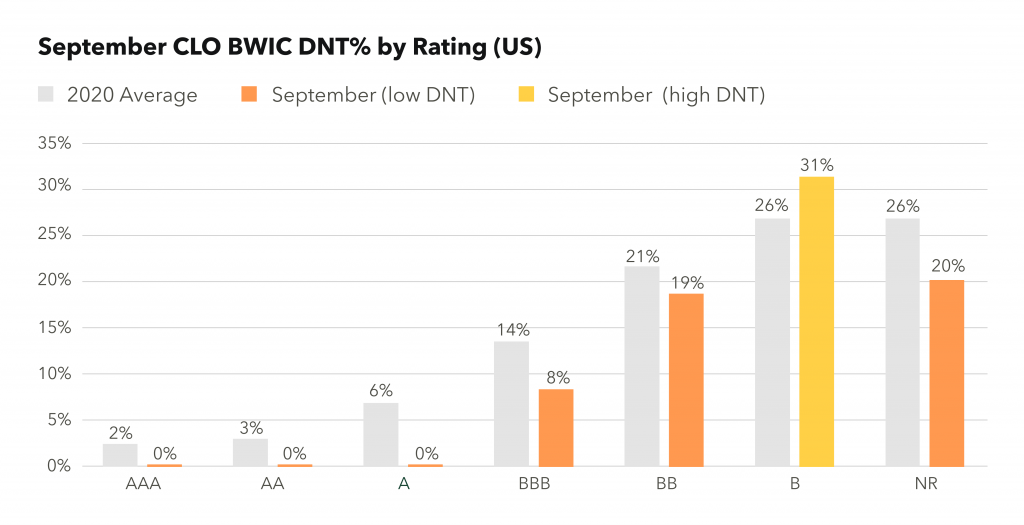
We see low DNT rates across investment-grade securities including a 0% DNT rate for AAAs, AAs and As. Low DNT rates are indicative of strong market demand and sellers being happy with the prices they’re receiving. Lower in the cap stack, the positive trend has returned in September and we observed lower than average DNT rates for BBB, BB and equity.
Dealer’s Inventory
Dealers purchased over $6 Bn from clients in September 2021, a sharp increase that seems to be driven by a single trade on September 22 in non-IG-rated securities.
Prices** Across the Stack
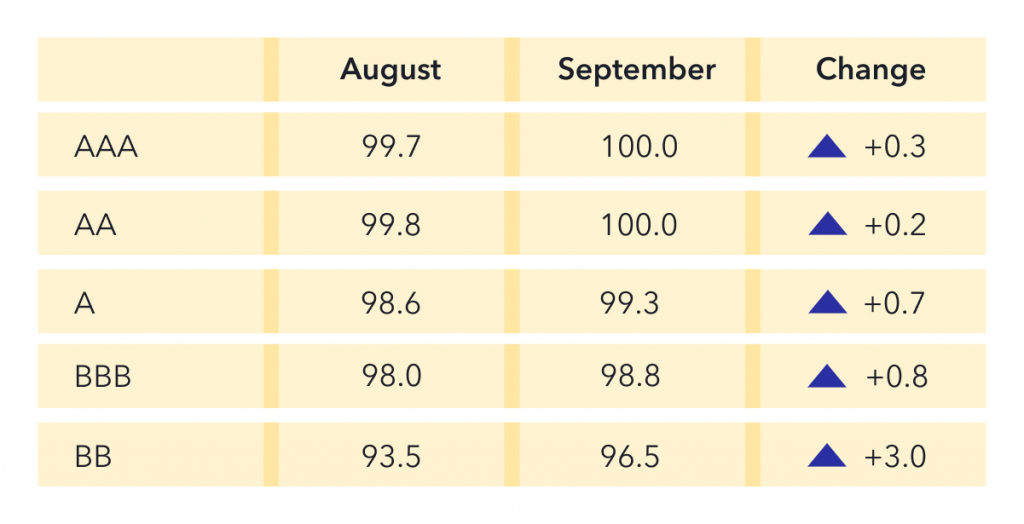
From August to September we saw price increases across the stack. The bottom part of the capital structure saw bigger improvements where BB-rated bonds were up 3 points.
CLO Equity IRRs
The last few months have seen an increased volume of CLO equity traded via BWIC. The average September equity IRR% based on the 18 trades with public color was 12.6% according to the standard secondary market pricing assumptions.
*TRACE reports all CLO trades involving FINRA members.
**Prices are based on trades that provided color and are likely to underestimate actual traded levels.