CLO Secondary Market Trends: October 2021 Edition
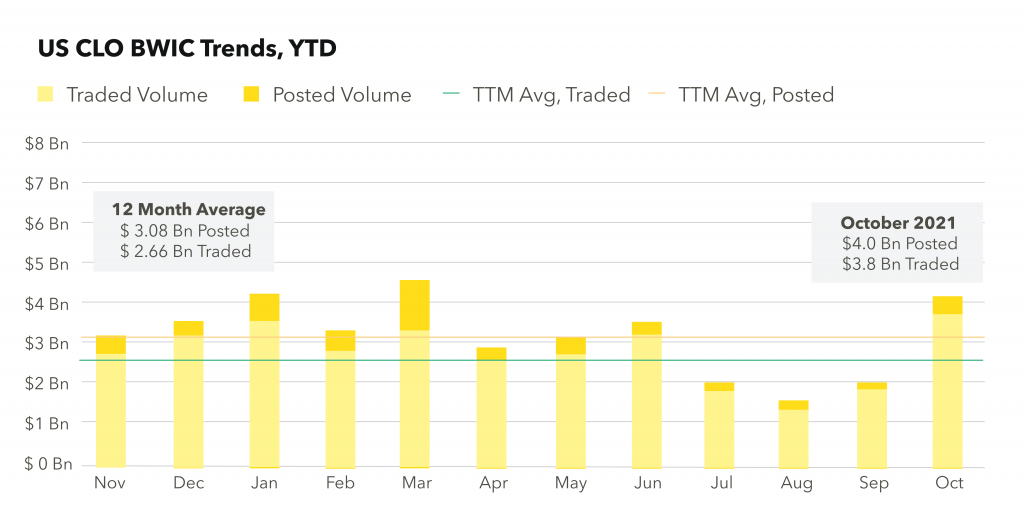
BWIC Volumes
October BWIC volumes saw a large increase over September, with over $4.0 Bn posted and $3.7 Bn traded. Posted and traded volumes continue to be close with over 90% of posted BWICs trading, pointing to a robust demand for the asset class. This strong month in secondary trading is taking place among the record amount of new issues, refis and reset transactions.
TRACE* Volumes
$13.2 Bn traded according to TRACE. This represents a slight decrease from September which saw $14.0 Bn traded. This brings the average investment grade volume to $6.6 Bn and the average non-investment grade volume to $5.3 Bn.
BWICs as % of TRACE
During October we saw increases in both investment grade and non-investment grade BWICs as a percentage of TRACE, with 34% and 19% respectively. The non-IG rate jumped up from 6% during September for non-investment grade.
BWIC Volumes By Rating
October saw volume increases across the stack. Of note, over $1.8 Bn of AAAs were traded via BWICs, compared to the 2021 average of just over $1.0 Bn. CLO equity had a big month with $480 MM traded compared to a 2021 average of $230 MM. This brings 2021 YTD of CLO equity posted on BWICs to $4.6 Bn for 2021 compared to $2.6 Bn in 2020 and 2019.
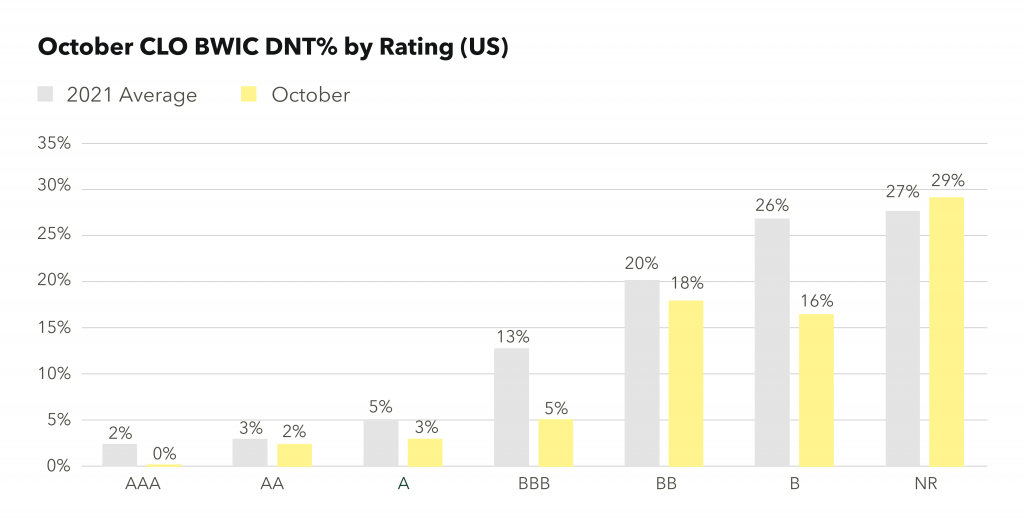
DNT Rates
October saw low DNT rates on AAAs listed on BWICs, and low figures for AA, A and BBB tranches. CLO equity had a DNT rate that was in line with 2021 averages at 29%.
Dealer’s Inventory
October reported just under $1.0 Bn being purchased by dealers from clients, making it the third-highest month in terms of total net flow and the second-highest month in terms of dealer purchases from clients.
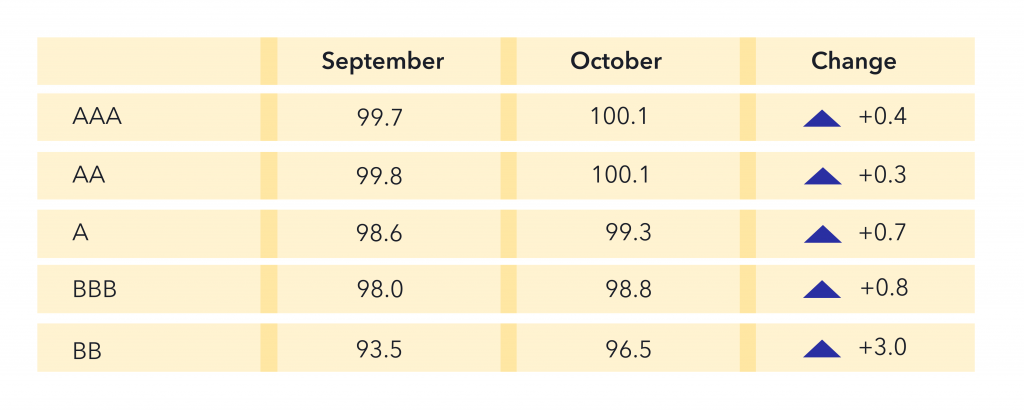
Prices** Across the Stack
From September to October, we saw price increases across the stack, with BBs up 3 points.
CLO Equity IRRs
During October, 52 CLO equity positions traded via BWIC with public color. CLO equity IRRs during the month averaged 11.8%. Substantial dispersion existed as usual: the lowest IRR being 3.7% and the highest being 19.2%.
*TRACE reports all CLO trades involving FINRA members.
**Prices are based on trades that provided color and are likely to underestimate actual traded levels.