CLO Secondary Market Trends: December 2021 Edition
BWIC Volumes
December had a total of $2.59 billion listed on BWICs, lower than November’s $4.34 billion. While posted BWIC volumes were high relative to the rest of the year, only 1.61 billion actually traded via BWIC, consistent with our research that quarter-end DNT spikes are caused by mark-to-market activities. The average volumes for the last 12 months are $3.14 billion for posted and $2.19 billion for traded.
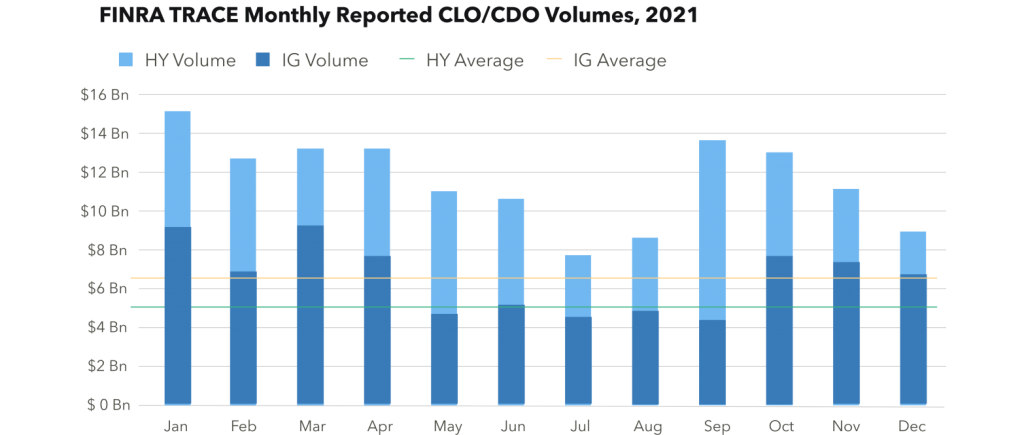
TRACE* Volumes
In December, a total of $9.48 billion traded. This represents a decrease from November which saw $11.26 billion traded. Of that $9.48 billion, $7.02 billion was investment grade and $2.46 billion was non-investment grade. This brings the average monthly IG volume to $6.59 billion and the average non-IG volume to $5.11 billion.
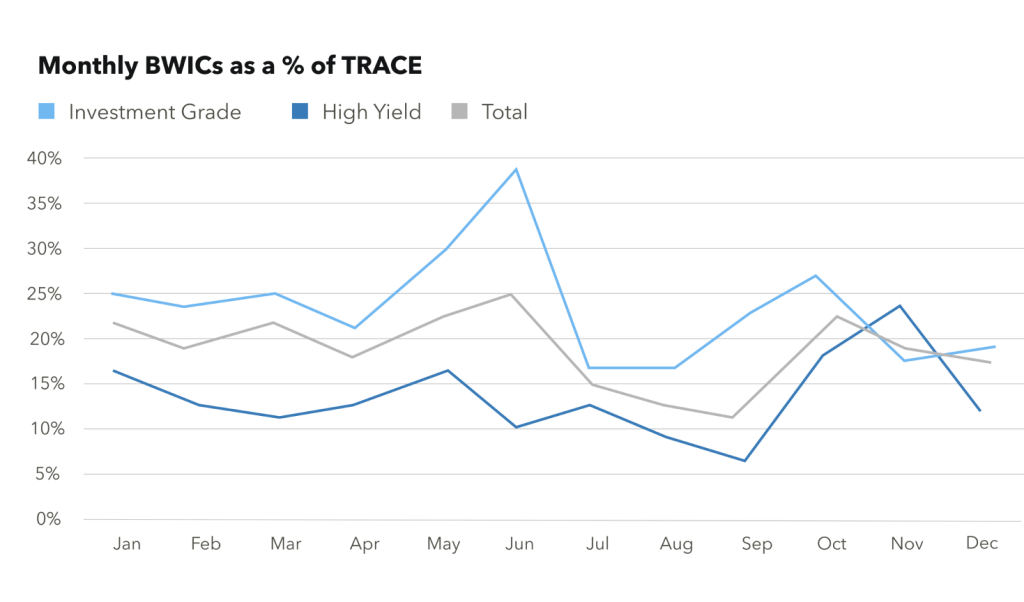
BWICs as % of TRACE
In December, the normal BWIC pattern of trading returned with IG BWICs as a share of TRACE were higher than HY, 19% and 12% respectively. Both return to figures lower than historical averages and showed that the majority of trading during December was out of comp.
BWIC Volumes by Rating
December 2021 saw a decrease in AAA BWIC volumes relative to the 2021 average: $770 million in AAAs were traded compared to a monthly average of $880 million. CLO equity saw a only $63 million traded during December compared to a monthly average of $231 million. Previously we’ve noted that CLO equity trading has increased drastically over the last several years.
DNT Rates
We’ve seen exceptionally low DNT rates the last several months indicating strong demand from buyers of securities- December 2021 saw a slightly higher DNT rate of 23.87% across the stack, with DNT rates higher in HY than IG. AAAs have had a strong 2021 with several months seeing a DNT rate of 0%. December had a AAA DNT rate of 12.39%, the highest level of the year, pointing to mark-to market activities by clients.
Dealer’s inventory
In December saw $321 million sold by dealers to clients. 2021 saw a great deal of activity, including September 2021 which had over $6 billion purchased by dealers.
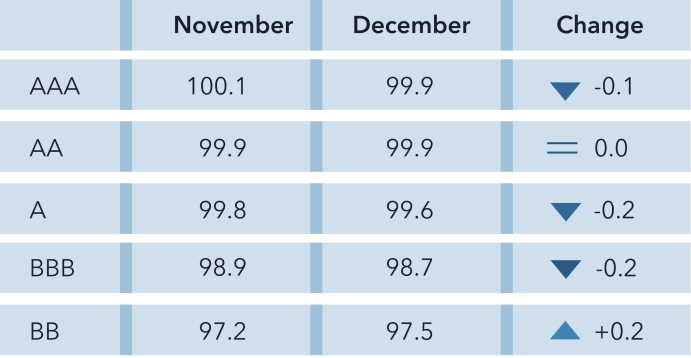
Prices** Across the Stack
Prices across the stack remained stable with little change.
*TRACE reports all CLO trades involving FINRA members.
**Prices are based on trades that provided color and are likely to underestimate actual traded levels.