CLO Secondary Market Trends: January 2021 Edition
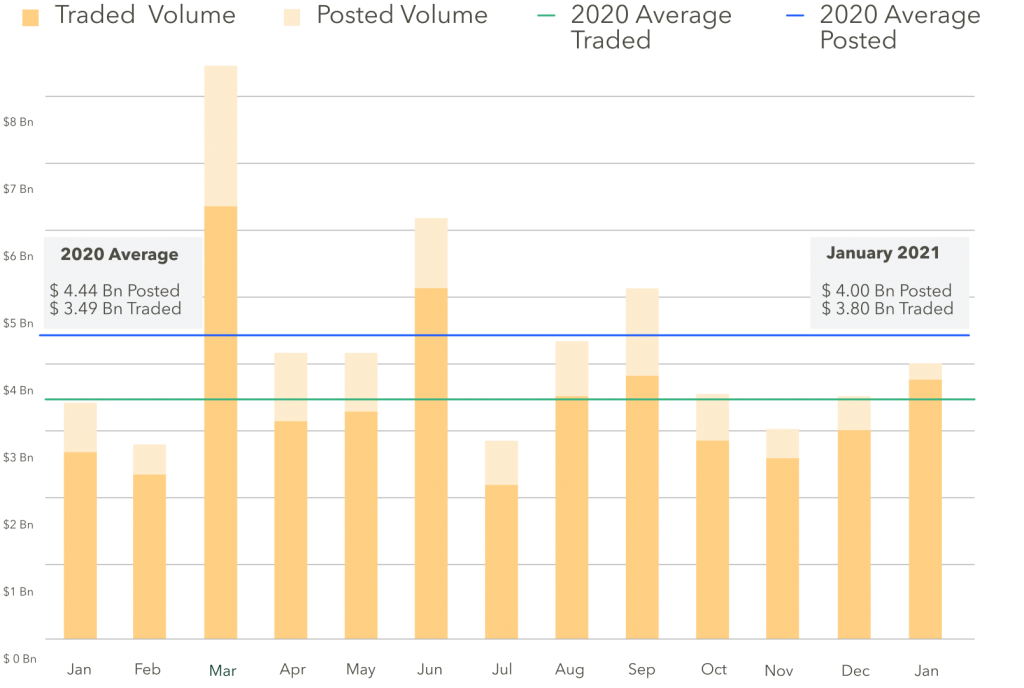
BWIC Volumes
January BWIC volumes were in line with 2020 averages and saw a modest increase from December with $4 Bn posted and $3.8 Bn traded. These figures point to continued demand for the asset class.
US CLO BWIC Trends, YTD
TRACE* Volumes
January saw an uptick in volumes compared to the last four months of 2020. A total of $15.0 Bn changed hands, $6.0 Bn of HY and $9.1 Bn of IG bonds, an increase versus the 2020 average.
*TRACE reports all CLO trades involving FINRA members
Dealers reduce inventory, for the second month in a row
2020 started off with dealers increasing their balance sheets through April, then beginning to unwind positions during the summer months, peaking in July. The strong market provided dealers the opportunity to reduce balance sheets in December, selling $288 MM of inventory to close out the year. This trend continued into January with an additional $674 MM of inventory being sold, indicating strong client demand.
TRACE IG BWICs consistent, while HY decreases
Over the last five years, BWICs have been roughly 1/3 of the TRACE reported volume, meaning the other 70% is out of comp. What we see in January is quite similar to what we observed in December with BWICs representing 28% of IG trades and 17% of HY trades.
AAA volumes lower than 2020 average, equity listings increase
2021 started off with lower than average AAA BWIC volumes with $1.5 Bn changing hands. Whereas equity trading volumes increased over 40% from the 2020s average and finished with an average trade size just under $6 MM.
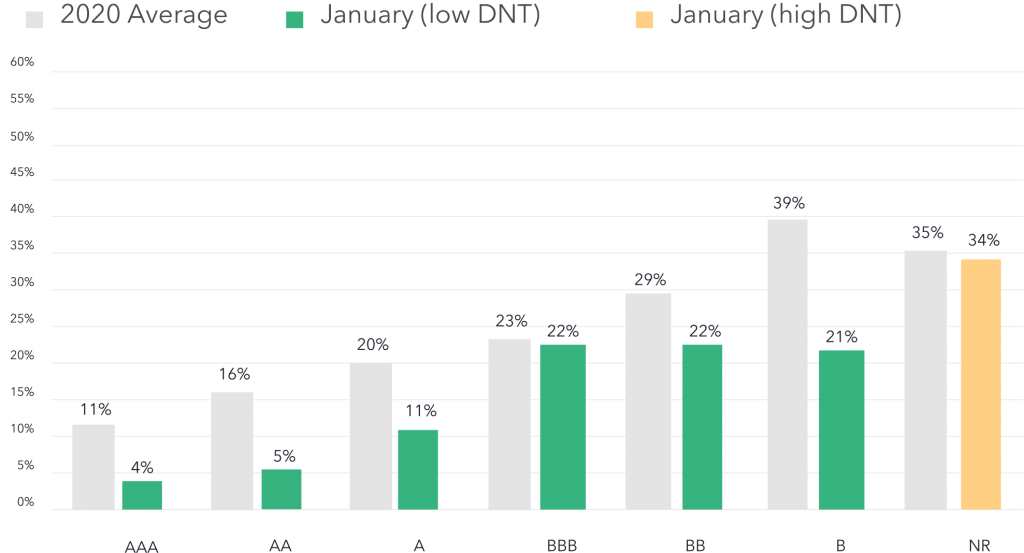
DNT Rates remain low
We look to DNT% as a proxy for demand. DNT rates were low across all rated debt compared to 2020 averages, especially for BBs and Bs, indicating strong market demand. Equity stayed flat with its 2020 average of 34% DNT.
January CLO BWIC DNT% by Rating (US)
Trade of the month
January saw two AMR refinancings, with more expected this year. Since AMR is a secondary activity, January’s largest trade was Seix’s MVEW XIV with its $252 MM AAA tranche, refinanced at 112 bps. As for proper BWICs, the largest trade was $23 MM of Octagon 23.
Prices* increase across the stack
Color is a proxy for actual traded price. From December to January we saw average prices increase across the board, including particularly strong improvements in the BB tranche, which increased 3 bps.
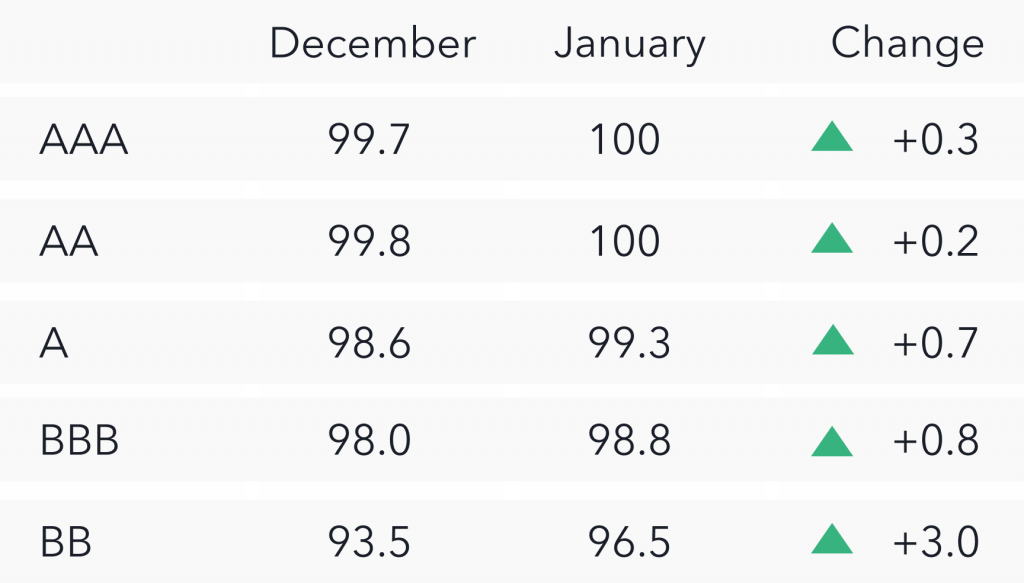
*Prices are based on trades that provided color and are likely to underestimate actual traded levels
Two AMR auctions attracted over $2 Bn in bids
January 2021 was a substantial month for AMR refinancings. The multi-dealer electronic refinancing mechanism has been embedded in 12 deals , two of which had auctions in January. Seix’s MVEW XIV auction received nearly $1.3 Bn in bids and was 3x oversubscribed. TCW 2019-1 had its first AMR auction in January 2020 and is the first CLO to utilize AMR for the second time. Over $800 MM of bids were submitted across the capital stack for TCW 2019-1.
New Feature: Issuance Monitor
The CLO Issuance Monitor is a centralized portal for all primary activity: new issues, refis and resets. Advanced filtering tools are available to allow focus on specific transaction types, ratings, reinvestment, or non-call periods along with 15 other portfolio characteristics. Investors are able to access granular deal details in five intuitive sections. Sign up here: https://bwic.kopentech.com