Riskoff sentiment drives a flood of trading in CLO AAAs

Given their floating-rate nature, leveraged loans and CLO securities avoided turbulence seen in other fixed-income instruments and equities in early 2022. However, with the Russia-Ukraine war, the cracks have started to appear and a flood of trading in the senior tranches, which is where it always begins, is starting to take place.
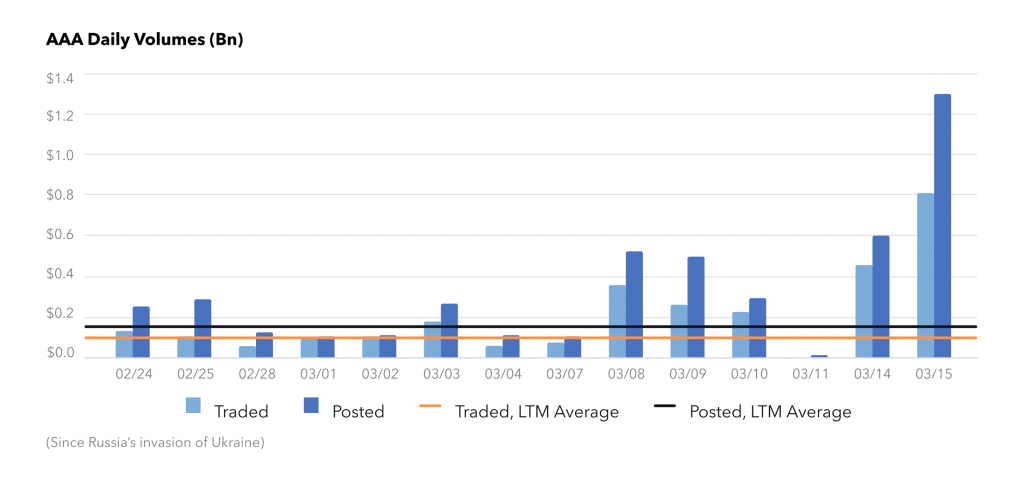
AAA Volumes: Highest Volume Ever
On March 15th, we saw an unprecedented $1.285BN of CLO AAAs posted on BWICs. This was the highest posted volume of AAA’s on BWIC since we began tracking this in June 2014. The second highest day was $1.1BN on October 8th 2019. To put this into context, the entire month of February 2022 was $1.45BN.
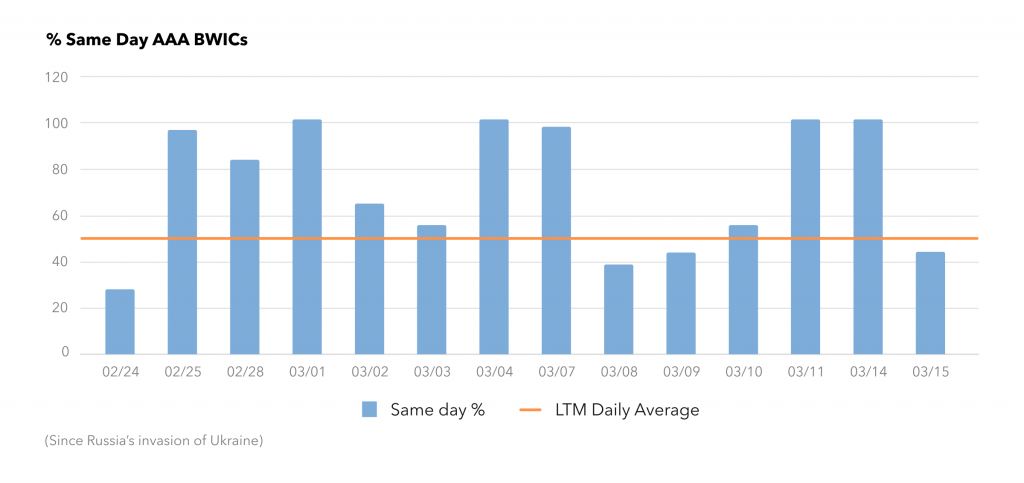
AAA Same-Day BWICs %: Stability Barometer
When same-day BWICs represent a large portion of the market, it can indicate market stress driven by redemptions and liquidity concerns. Not surprising with the volatility in the market, same day BWICS has jumped from an LTM average of 50% to 72%.
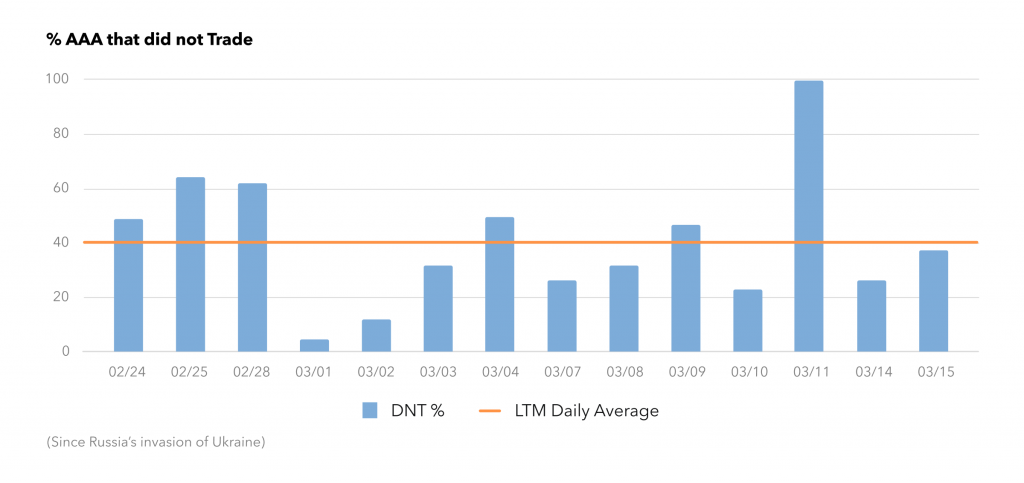
AAA DNT %: Demand Barometer
Lower DNT rates indicate stronger demand, higher DNT rates indicate weaker demand. Interestingly, DNT rates for AAA have stayed in line with the LTM average of 41%, except for 3.11.22 where nothing traded. This is encouraging and indicates that selling is being met with a healthy buying interest. This makes sense given AAA prices in the secondary are now priced below par (a rare occurrence) and primary issuance has halted.
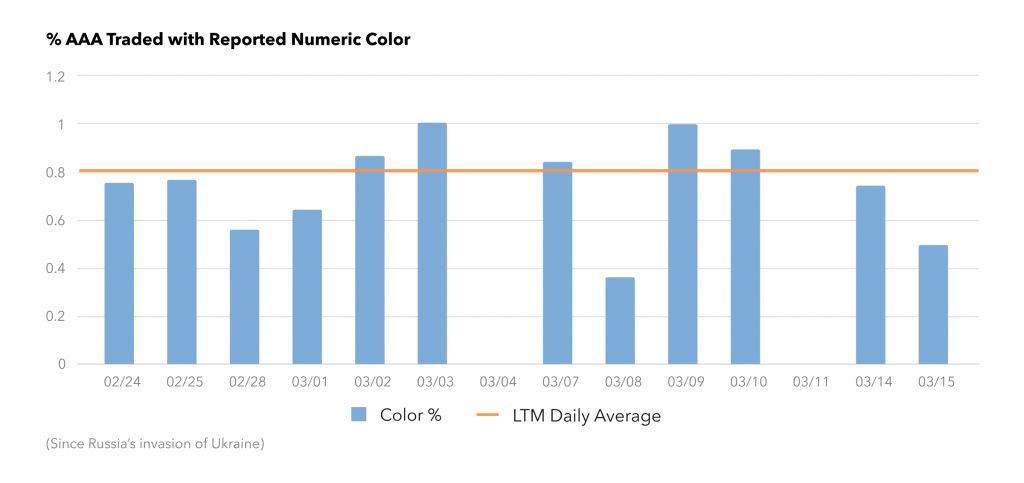
AAA Color % in BWICS: Transparency Barometer
When color % in BWICS is low, it indicates poor market transparency which, in turn, contributes to illiquidity. Transparency is down since the Russia-Ukraine crisis and, in particular, 2 days March 4th and March 11th 2022 had zero visibility. This is indicative of the fact that sellers are not achieving their desired prices and are reluctant to post color. Equally important, it might also signify they have more to sell on the follow.
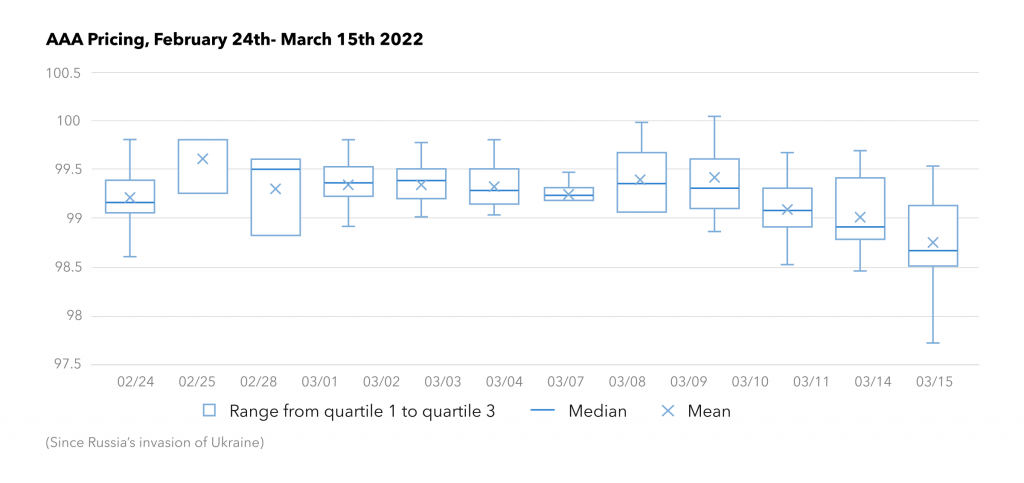
AAA Prices and Price Range
For LTM and through the middle of February, we have measured AAA prices in basis points of spread and for the most part everything traded around par. Now, we are measuring AAAs based on price. The widest range of color was 1.79 points on March 15th, 2022, which is significant for securities that generally are clustered around 100 with only a 0.5-point deviation. AAA prices on average are down .75 points with what looks to be a continuing downward trend.
KopenTech is the premier source of secondary and primary issuance data for the CLO marketplace. Get this information and more at bwic.kopentech.com.