CLO Secondary Market Trends: February 2021 Edition
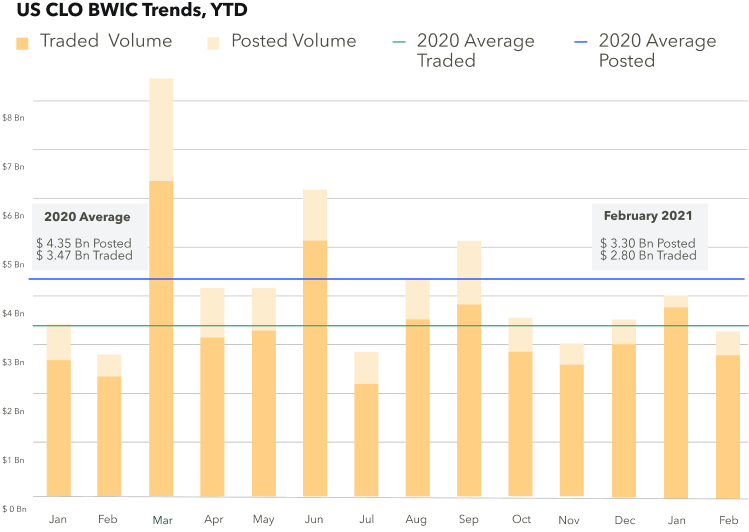
BWIC Volumes
February BWIC volumes dropped slightly to $3.3 Bn vs $4.0 Bn in January However $2.8 Bn traded demonstrating continued demand for the asset class.
TRACE Volumes
The first two months of 2021 saw increased CLO trading volumes with a total of approximately $13 Bn traded, $5.5 Bn of which were high yield bonds.
Dealer inventory
Dealers reduced balance sheets in December selling $300 MM of inventory, this trend continued in January with dealers selling over $674 MM, $600 MM of which was AMR-related. During February, another $630 MM was sold from dealer inventory to clients, reflecting strong demand from clients.
BWICs as a % TRACE
Over the last five years, BWICs have accounted for roughly 1/3 of the TRACE reported volume, however we saw a notable decline in both IG and HY volumes from 52% of TRACE volume to 35% and from 29% to 18%, respectfully.
BWIC volumes by rating
February volumes were lower than average for across the capital stack except for A-rated and equity tranches. AAA volumes were $1.1 Bn versus the $1.8 Bn monthly average. There were two days with over $1 Bn in volumes: February 3rd and February 23rd. Average trade sizes were also slightly lower in AAA, BB and equity while slightly higher trade sizes for AA, A and BBB.
Trade of the month
In February we saw a $50 MM slice of Cerberus 2018 change hands and average AAA trade size was $5.4 MM.
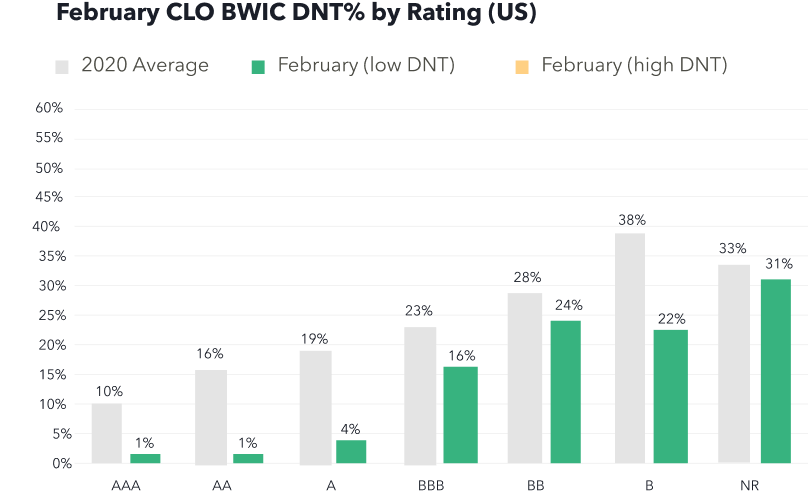
DNT Rates remain low
We look to DNT% as a proxy for demand. DNT rates were low across all rated debt reflecting strong investor demand across the capital stack, including single-digit DNT rates for AAA, AA and A rated securities.
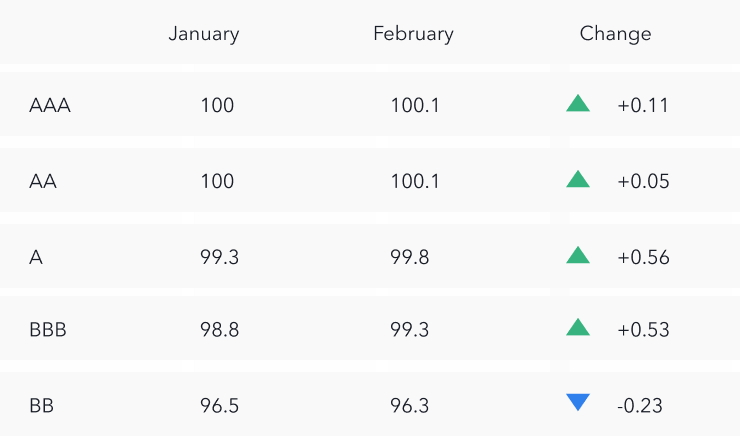
Prices increase across the stack
Color is a proxy for actual traded price. From January to February, we saw average prices increase with the exception of BB bonds. Both single A and BBB had strong performance with a price increase of over half a point.
Your complete guide to CLO Market Monitoring
Improve your CLO trading execution with access to six years of historical data, analytics and research. Visit the Dashboard for trading volume barometers, market health indicators and portfolio tools. Sign up here: https://bwic.kopentech.com/signup