CLO Market Trends: March 2022 Edition
Secondary Trading Highest in 7 Years
March Webinar Guest Speaker: Laila Kollmorgen, Portfolio Manager, PineBridge Investments
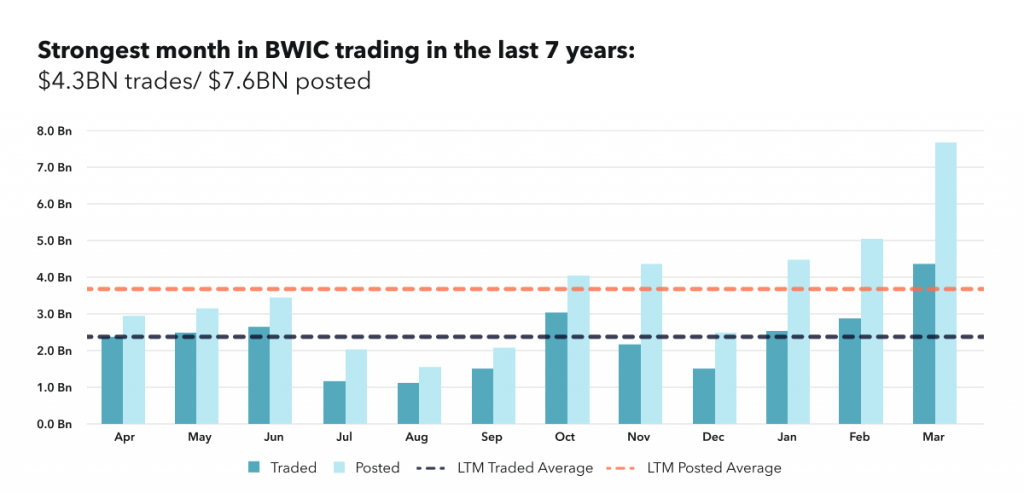
BWIC Volumes Largest in 7 Years
March was the strongest month in BWIC trading and the second largest posted in the last 7 years: $4.3BN trades/ $7.6BN posted. This matches the typical trend: trade flows increase during market stress as investors reposition their books.
“[talking about senior CLO tranches], as a manager constantly comparing relative value vs. other credit asset classes, such as CMBS, we as certain that CLOs are, in fact, rich.” said Laila Kollmorgen.
TRACE Volumes Driven by AAA
TRACE volume was up again with new monthly high of $21BN and we see this continues to be driven by investment grade. This is up 30% since February, although falls short of the all-time high of $28BN in March of 2020.
“AAAs were often done with a few accounts. With Covid in 2020, syndicate desks had to actually syndicate. This meant more buyers. These AAA buyers will be moving in and out depending on their needs and views on relative value“ said Laila Kollmorgen.
Dealer Desks were not large purchases of CLOs
Dealer net flows show clients selling $72MM; so, market-makers were not the end buyers. This was clients selling and clients buying.
“We began selling in January and February; in March, we started opportunistically buying, as levels vs. other asset classes became more attractive.” said Laila Kollmorgen.
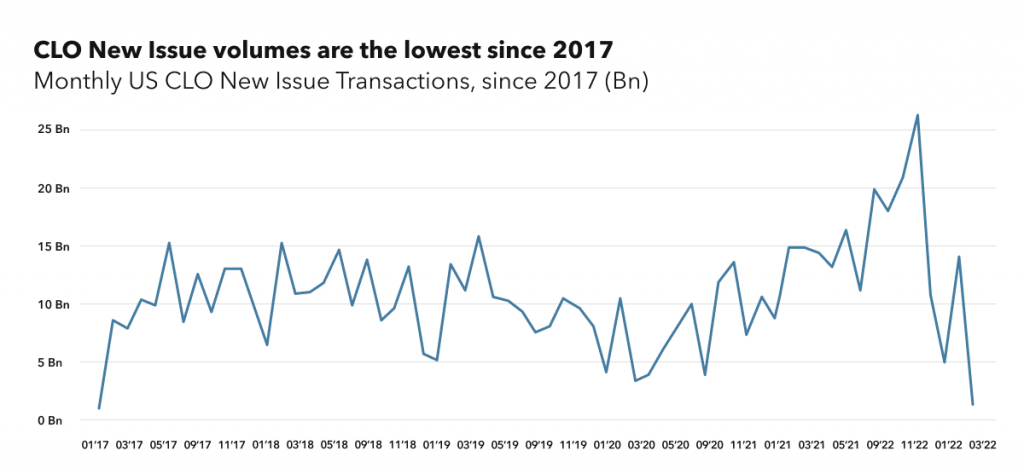
New Issue Lowest since 2017
New Issue CLO volumes are the lowest since 2017, dropping to $1.36BN for the month of March.
“Volumes cratered due to broader macro volatility we saw in March. It didn’t matter the asset class, you weren’t going to do a new issue. Even club-like deals were very difficult. People are taking time to recharge; new issue will be coming in the next few months and into the summer.” said Laila Kollmorgen.
BWIC Volumes by Rating
BWIC volume increase is driven by AAA tranches which doubled to $3.06BN. This is highlighting the relative value at the top of the CLO capital structure might be in favor of other credit asset classes.
Prices** and DNT Rates
BWIC DNT% are higher across the stack pointing to market stress. IG Prices continued to fall in March, with BBB’s lower by 1.8 points. HY reversed and was up 1.2 points.
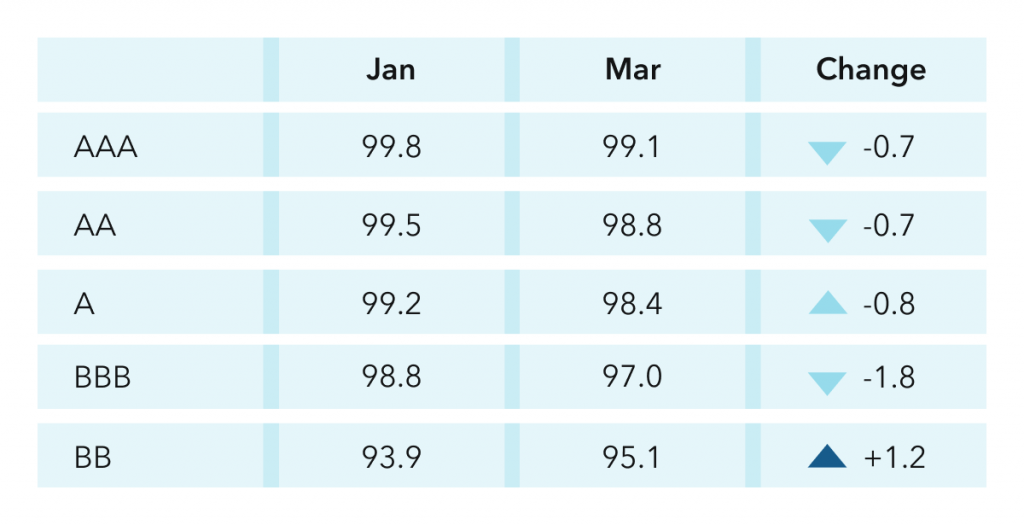
**Prices are based on trades that provided color and are likely to underestimate actual traded levels.
To receive full monthly data package on CLO primary and secondary trends and to be invited to our monthly webinars signing up at bwic.kopentech.com and/or join Fixed Income Investor Network (FIIN) at thefiin.org. Kopentech ATS has partnered with FIIN buy-side network to provide monthly data and buy-side investor commentary on CLO market trends.
*TRACE reports all CLO trades involving FINRA members.
**Prices are based on trades that provided color and are likely to underestimate actual traded levels.