CLO Secondary Market Trends: November 2021 Edition
BWIC Volumes
November had a total of $4.3 billion listed on BWICs. This was the highest monthly volume for 2021, which brings the total 2021 YTD BWIC volume to $28.6 billion listed. The average volumes for the last 12 months are $3.2 billion for posted and $2.3 billion for traded.
TRACE* Volumes
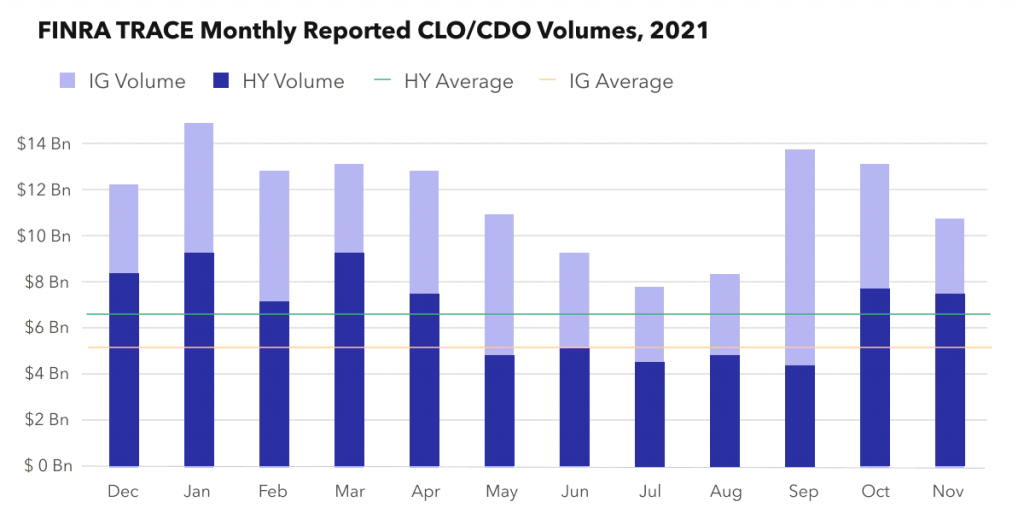
In November, a total of $11.3 billion traded. This represents a slight decrease from October which saw $13.2 billion traded. Of that $11.3 billion, $7.7 billion was investment grade and $3.6 billion was non-investment grade. This brings the average IG volume to just under $7 billion and the average non-IG volume to $5 billion.
BWICs as a % of TRACE
November saw a reversal of the prior month’s trends: IG BWICs decreased as a share of TRACE volume to 17%, while non-IG rated tranches on BWICs increased to 24% of TRACE.
BWIC Volumes by Rating
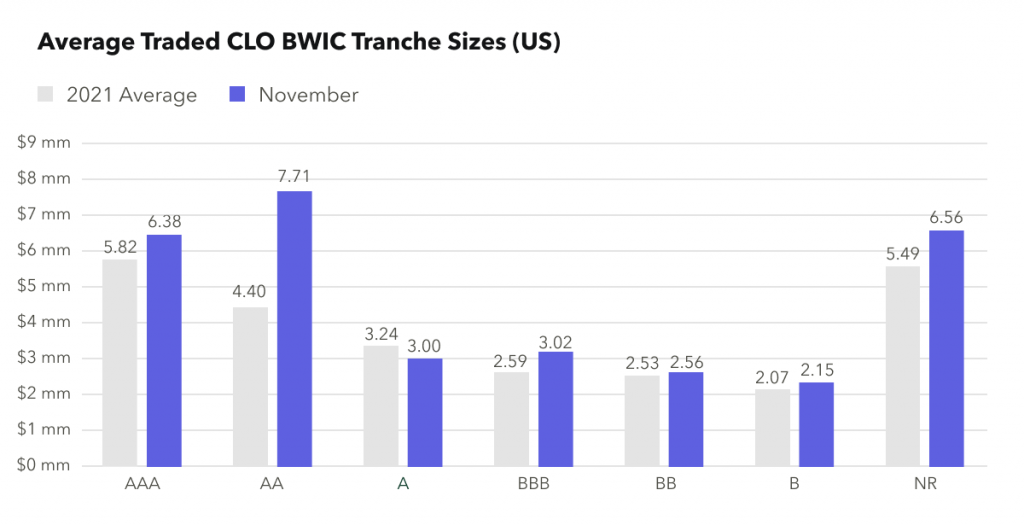
November 2021 saw a decrease in AAA BWIC volumes relative to the 2021 average: only $770 million in AAAs were posted compared to a monthly average of $890 million. CLO equity saw a large increase in traded volumes with $410 million traded compared to a 2021 average of $230 million. CLO equity is on pace to nearly double the traded volume from 2020.
DNT Rates
We’ve seen exceptionally low DNT rates the last several months. However, in November we’ve seen a reversal of that trend with higher-than-average DNT rates for AAA, AA, BB, B. Specifically, we’ve seen AAAs with several months of 0% DNT rates. This month we saw the DNT rate increase to 4.7%. AA DNT rates also increased to 16.7%.
Dealer’s Inventory
November saw the third consecutive month of dealer net purchases from clients. This time dealers purchased $325 million from buyside investors.
Prices** Across the Stack
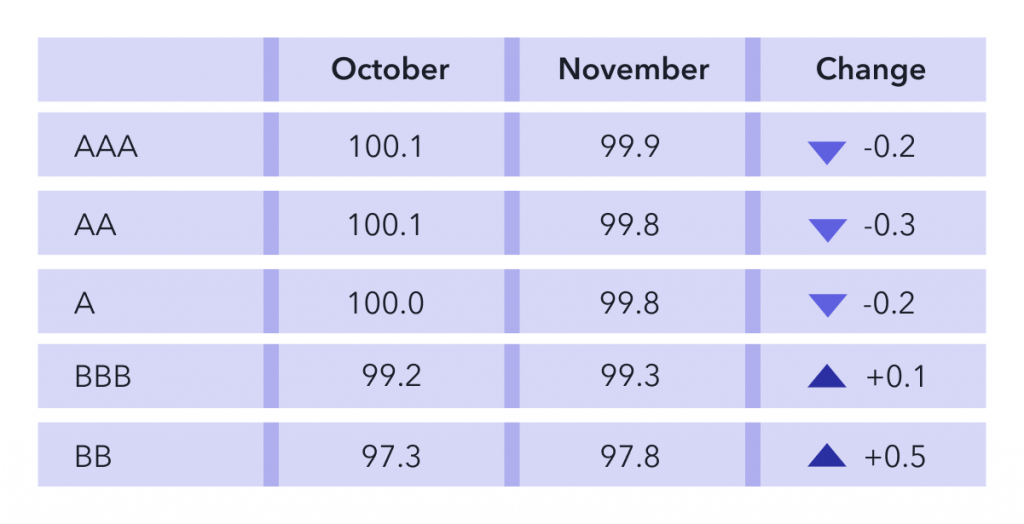
November price action across ratings was mixed. From October to November we saw slight price decreases/spread widening for AAA, AA and A, while lower mezzanine prices have increased for both BBB and BB. In particular, BB prices were up half a point.
*TRACE reports all CLO trades involving FINRA members.
**Prices are based on trades that provided color and are likely to underestimate actual traded levels.

