CLO Market Trends: August 2022 Edition
Guest Speaker: Olga Chernova, Sancus Capital Management
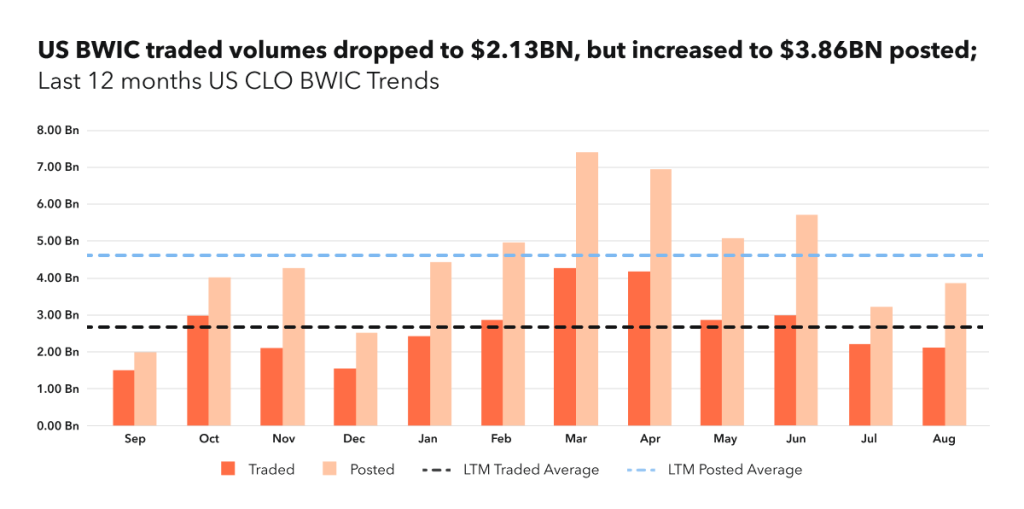
BWIC Volumes
August BWIC volumes are down slightly from last month which was not surprising for a typical summer slowdown. BWICs traded were $2.13BN with $3.86BN posted, year-to-date volume is still tracking 46% higher at $24.32BN traded versus $15.48BN in 2021.
BWIC Volumes by Rating
BWIC volumes continue to be driven by IG-rated tranches. However, IG has dropped for the third month in a row to 80% of total largely driven by a significant drop in AAAs with only $1BN traded.
“Lower IG volumes are not surprising given that the primary market was more attractive. The relative difference was less pronounced lower in the stack.” – Olga Chernova
TRACE Volumes and DNT rates
TRACE volume is up slightly from July to $11.39BN though still drastically lower vs March highs of $21BN. DNT % for AAAs was higher at 48%, BB and Equity DNT% rose as well and exceeded 50%. With the volatility in the market, investors were more active in non-competitive trading.
Dealer’s Inventory
Dealer net flows show clients buying $91.28MM in August which is down from them buying $529MM in July. It seems dealers are continuing to de-risk.
“Investors were buyers of risk as companies were reporting strong earnings and the consensus shifted to an economic recession not being imminent. Buying slowed vs. July when prices were more attractive”. – Olga Chernova
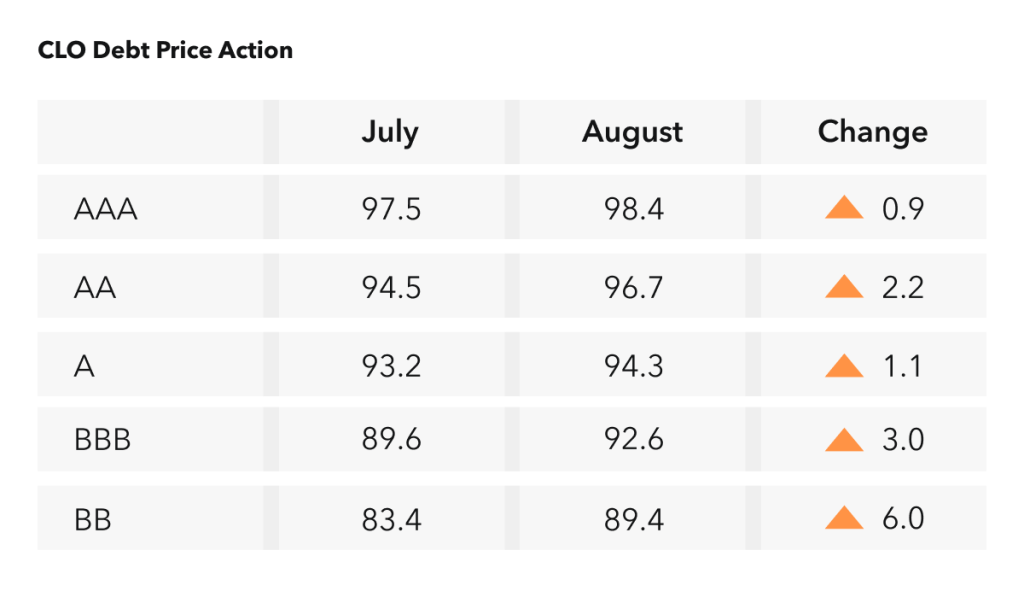
Prices Across the Stack
Prices increased, especially in lower mezzanine: BBs were up 6 points and BBBs had a big move as well up 3 points. The move up across the stack can be attributed to the underlying loan market which rallied from 92 in late July, up almost 4 points by mid-August.
“The August rally was powered by lowering expectations of an imminent recession and growing hopes of a dovish Fed pivot. At Jackson hole, the Fed promised “more pain” to come in its fight against inflation. HY funds had close to $5BN in outflows in 2 consecutive weeks and leverage loans followed.” – Olga Chernova
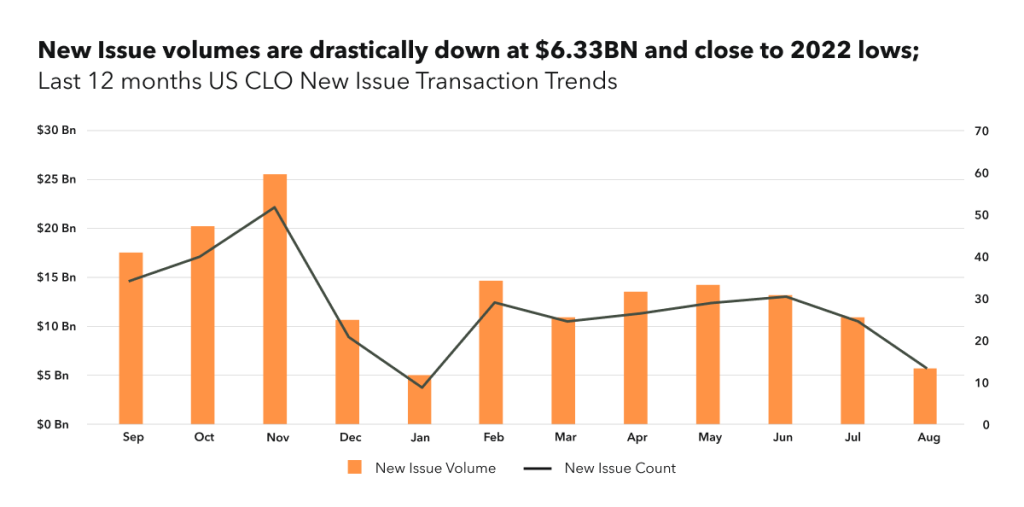
New Issue
New Issue CLO volumes were drastically down from $12.21BN in July to $6.33BN in August which was close to the 2022 lows, eclipsed only by the lows of “Libor Transition” seen in January. Historically the change between July and August has never been so pronounced as it was this year which was more due to market stress and dislocations.
New issue was dominated by transactions with longer reinvestment period (>3.5yrs) and AAA spreads were at 200-245bps, the widest range in the last twelve months. The primary BSL AAA curve inversion normalized with longer- duration spreads being wider; however, only 2 short-reinvestment deals were observed.
K-Indicator
Kopentech has launched the K- indicator which is a multifactor CLO Market Stress Indicator. K-indicator enables market participants to better track conditions within the CLO market. This is comprised of 5 factors of equal measurement and a reading below zero corresponds to unfavorable conditions. In August the reading was below zero and moved sideways despite the rally, given that other barometer factors were lower.
Get up to the minute data on CLO new issue and secondary BWIC trading by signing up at kopentech.com.
Please join us on October 7th for Market Trends Webinar and register here.