CLO Secondary Market Trends: December 2020 Edition
BWIC Volumes:
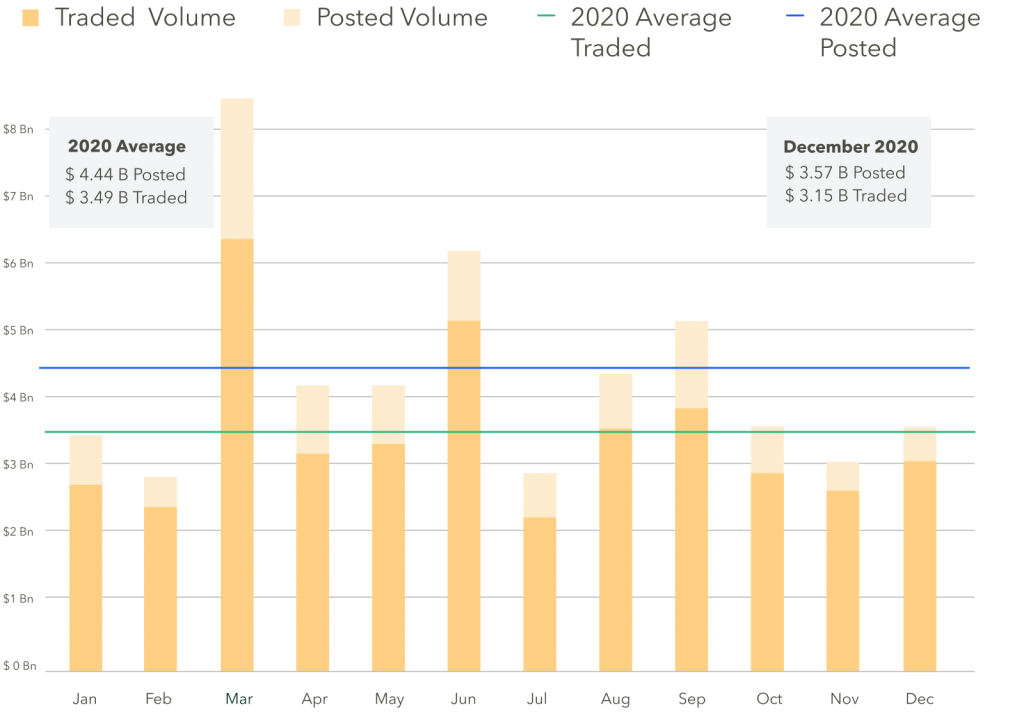
December BWICs saw a slight rebound above the 2020 average traded volume, with 3.15 B traded.
US CLO BWIC Trends, 2020:
TRACE Volumes
TRACE reports all CLO trades involving FINRA members, including those done outside of BWICs. December was the second slowest month for TRACE-reported CLO trading in 2020. Recorded TRACE trading volumes were less than the 2020 average, with just over $12 B changing hands in December.
Dealers offload inventory to the marketplace in December
Since August, we’ve seen dealers expanding their balance sheets. The strong market offloaded in a big way in December, selling off over $600 MM of inventory to close the year.
HY bounces to June/July highs
IG BWICs stayed flat at 28% of TRACE reported volumes, while HY saw its third-highest volumes of the year at 20%.
AAA and AA lower than average, while lower ratings all increase
IG trading volumes were lower than the year’s average at $1.24 B and trade sizes also decreased.HY and equity returned strong from a slower November. Most notably, equity trade size increased to 7.94 MM, the largest we’ve seen in 2020.
Pro Tip: Access CLO data and market health indicators on the Dashboard
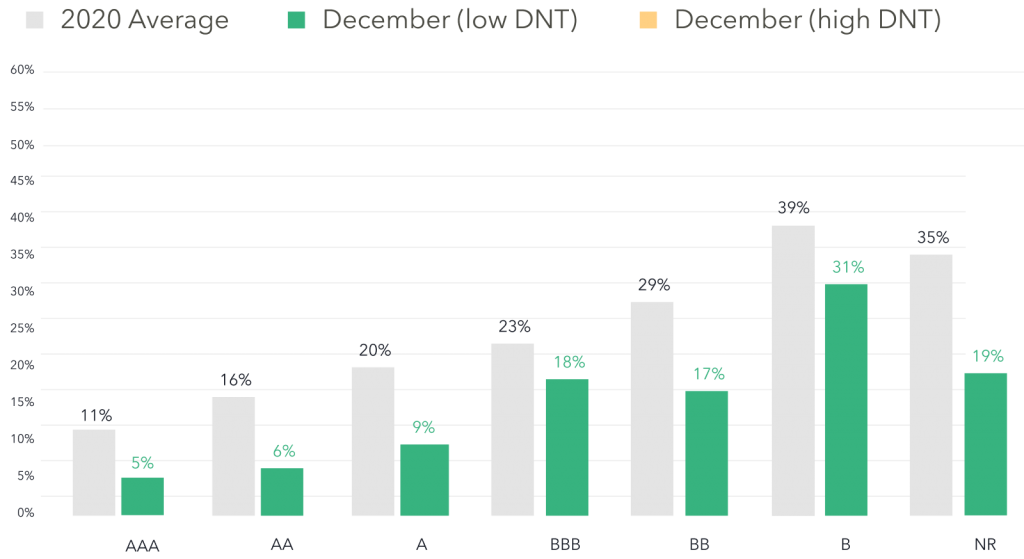
DNT Rates
We look to DNT% as a proxy for demand. Bond DNT rates were down in all tranches post-election and vaccine news, indicating strong market demand across the capital stack. Notably, equity DNT rates in December down to 19% from the year’s 35% average.
December CLO BWIC DNT% by Rating (US)
Trade of the month
December’s largest was a Bain Capital Credit bond with a $50 million piece of AAA paper. This was one of the largest trades on BWIC in 2020. The average AAA trade size this month was $5.7 MM.
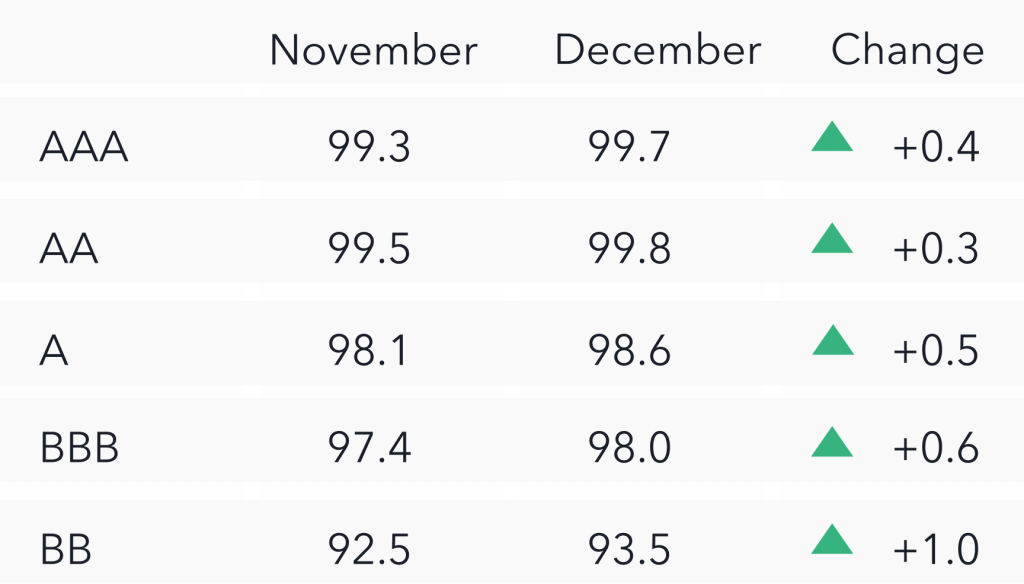
Prices* up across the stack
Color is a proxy for actual traded price. From November to December we saw average prices increase across the capital stack, including particularly strong improvements in the BB tranche with an average increase +1.0 bp.
Dashboard update
We frequently update our Dashboard with useful tools, graphs, and tables to improve the way our clients execute. Next week, we will be releasing: Historical AAA Price Graph, Graph with Px Talk Deviation from Color, and Most Liquid Bonds Table. For access, sign up on the KopenTech website.
*Prices are based on trades that provided color (usually second highest bid) and are likely to underestimate actual traded levels