CLO Secondary Market Trends: July 2021 Edition
BWIC Volumes
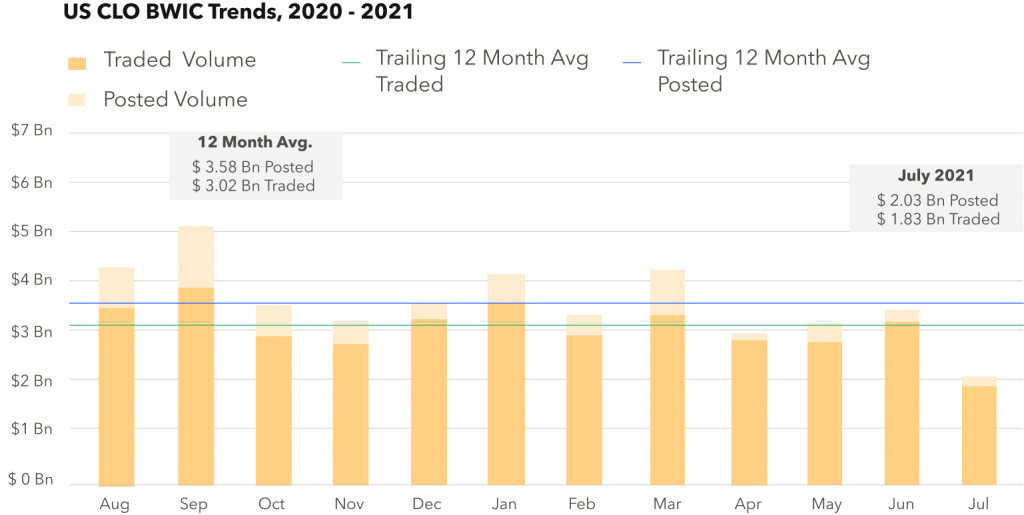
July BWIC volumes dropped significantly in comparison to June. Posted and Traded volumes were $2.03 Bn and $1.83 Bn, respectively. We also saw a continuation of the trend of high ratio of successful BWICs continue in July.
TRACE* Volumes
Reported CLO trading volumes were $8.0 Bn in July, down over $2.0 Bn from May. This marks a 12-month low for IG + HY trading volumes, attributed to the summer slow down.
BWICs as % of TRACE
IG-rated tranches executed via BWICs returned to 29% of the overall TRACE volume after a spike to 47% last month. HY tranches, on the other hand, were relatively stable at 15% of TRACE.
BWIC Volumes By Rating
In July, B/CCC BWIC volumes were slightly above the 12-month trailing average while equity volumes were more than double the average, pointing to the continued high demand for equity. The rest of the capital stack saw low volumes.
DNT Rates
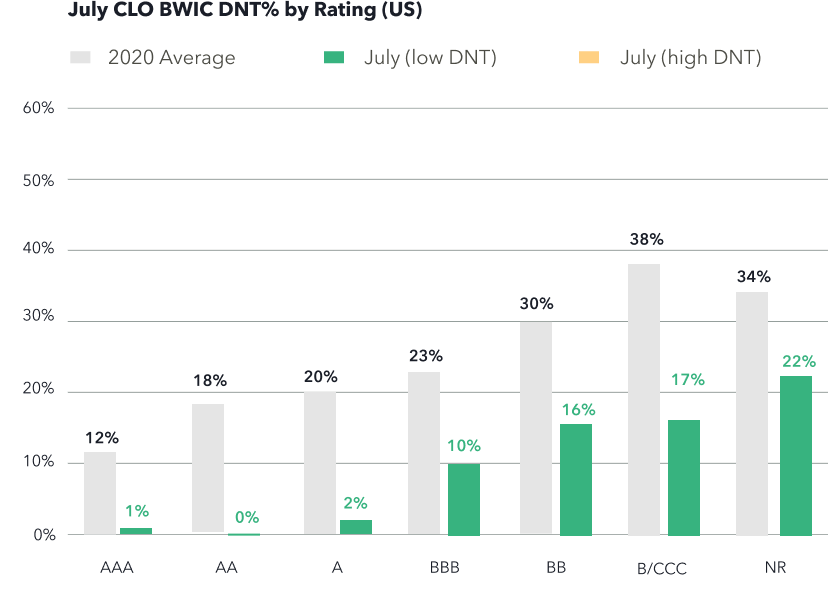
CLOs continued their trend of low DNT%, with 99% of AAA BWICs trading, and 100% of AA also trading. Low DNT rates across the stack indicate strong demand.
Dealers Inventory
In July, dealer desks had net purchases of $103 mm from clients. This is only the second month of net buying activity from dealers in 2021, with $271 mm of inflows in May. In January and February we saw outflows exceeding $600 mm, and April saw outflows of over $1.1 Bn.
Prices** Across the Stack
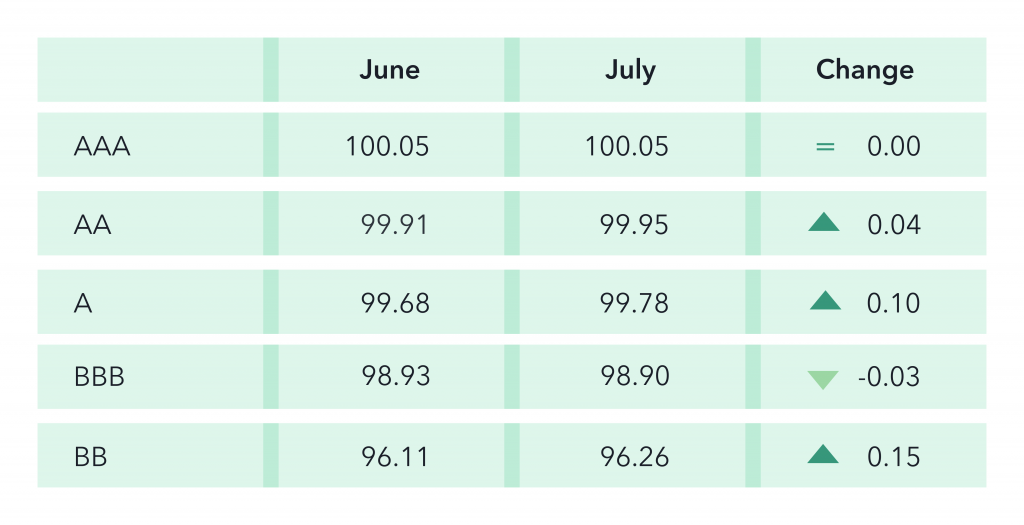
Prices stayed stable except A and BB, which had marginal increases of 0.1 and 0.15 respectively.
CLO Equity IRRs
The last few months have seen increased volume of CLO equity traded via BWIC. KopenTech analysts investigated the expected IRR of CLO equity that traded with public color given, utilizing standard industry assumptions across a total of 30 data points in July (twice as many trades completed in June). The resultant expected IRR was 11%, down from 13% in June.
*TRACE reports all CLO trades involving FINRA members.
**Prices are based on trades that provided color and are likely to underestimate actual traded levels.

