CLO Market Trends: February 2022 Edition
BWIC Volumes
February total posted volumes continued to increase and rose to $5 Bn. This is the highest we have seen all year. However, with only $2.9 Bn traded, this is low compared to last February with $3.4 Bn. So, despite high posting volumes, BWIC traded volume is down from last year. The average for the last 12 months has ticked up to $3.3 Bn posted and $2.2 Bn traded.
BWIC Volumes by Rating
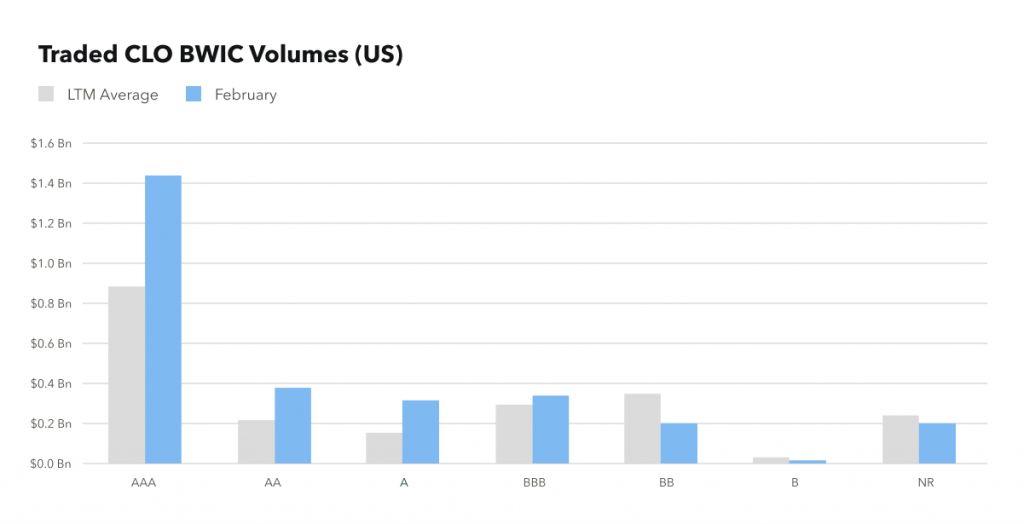
February saw an overall increase in trading of IG-rated tranches with a large increase in AAA trading. We saw a 55% increase with $1.45 Bn in AAAs traded versus the average of $0.9 Bn. HY and Equity volumes were down, with BBs off by 50% to 0.2 Bn.
TRACE Volumes
In February, total TRACE volumes were $16 Bn. This is a slight increase from January’s $15 Bn. One difference we do see from last month is a higher proportion of investment grade. The composition of IG trading went from 66.7% in January to 81.25% in February. This brings the average investment grade volume to $7 billion and the average high yield volume to $5 Bn.
BWICs as a % of TRACE
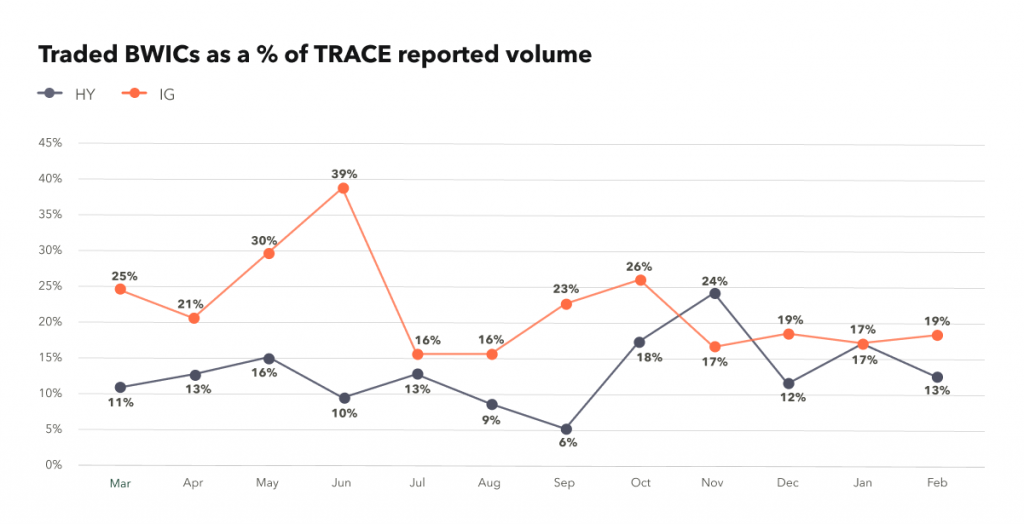
Total BWIC as a % of TRACE has historically been around 35% and for February, it is in line at 32%. Breaking that down further, IG-rated bonds normally constitute a larger percentage versus HY. In February, the composition of IG and HY was 19% and 13%, respectively.
DNT Rates
We look at DNT rates as a proxy for demand. Lower DNT rates indicate stronger demand, higher DNT rates indicate weaker demand. In February, we saw higher DNT rates across the board except for AAs. This is pointing to market stress.
Dealer’s Inventory
February 2022 broker-dealer trades show a net outflow with $523 million being purchased by clients. This is up from being flat in January.
Prices** Across the Stack
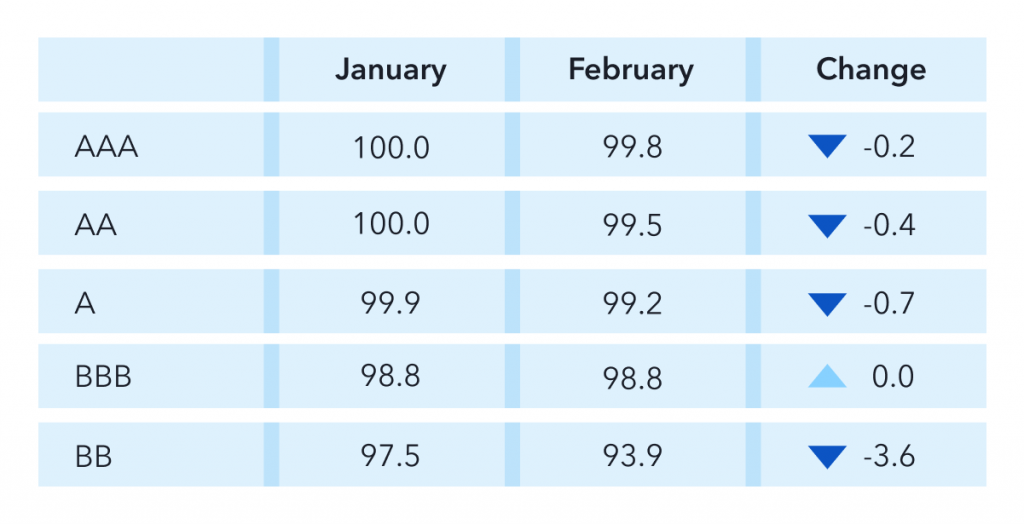
From January to February, prices are slightly down for investment grade. The largest decrease was in BBs which dropped by 3.6 points.
Sign Up for Market Updates
If you want to look for information on CLO bonds including price talk and color, all of this is on our BWIC platform. We have captured 97% of all the BWICS done in the past 7 years and all that information is available to platform users. Email us at info.kopentech.com for a demo.
*TRACE reports all CLO trades involving FINRA members.
**Prices are based on trades that provided color and are likely to underestimate actual traded levels.

