CLO Market Trends: April 2023 Edition
BWIC volumes are up 66%, while overall TRACE volumes are down. CLO prices are close to LTM highs.
April Webinar Guest Speaker: Eddy Piedra, 40/86 Advisors
BWIC Volumes
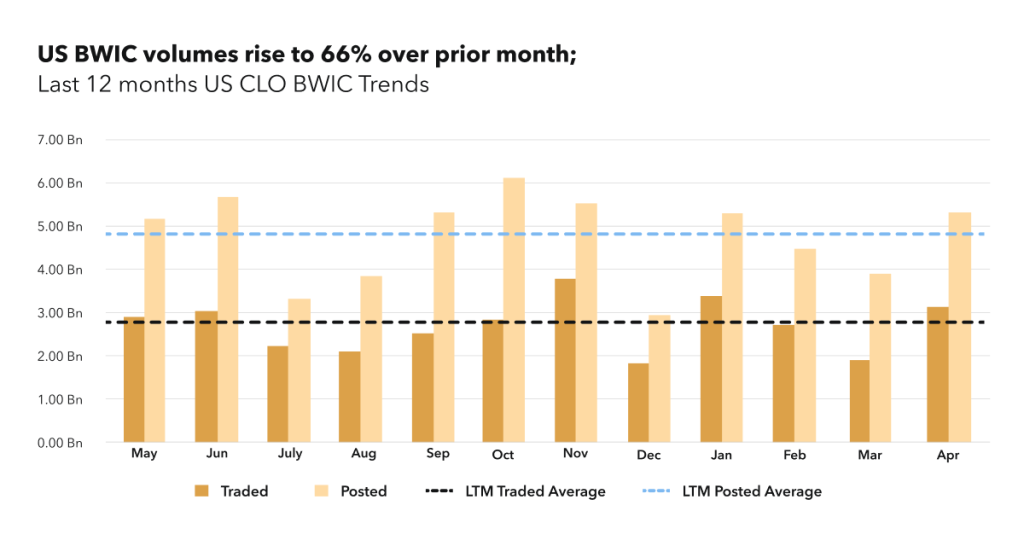
US BWIC volumes rise above LTM averages in April, with 66% increase in traded volume compared to last month (now $3.1BN). Posted volumes increase by 32% from March (now $5.2BN). Despite this increase, YTD volumes are still 20% lower than 2022 numbers, both in posted and traded.
“In April the markets had a rebound. Markets stabilized, price discovery was easier and execution risk of BWICs was not as risky. All are a sign of a healthier market.” – Eddy Piedra.
BWIC Volumes by Rating & DNT rates
April saw a growth in AA trading, with $1BN traded compared to LTM average of $364MM. Equity trading increased as well, from $146MM traded on average (LTM) to $431MM traded in April. AAA trading, however, slowed down, from $1.3BN LTM average to $795MM. This caused the drop in IG share in US BWICs, from 86% in March to 76% in April.
DNT rates decreased for IG tranches except for BBB, where DNT% rose slightly to 18%. HY tranches all saw increased DNT rate. Interestingly. AA DNT% was lower than AAA DNT%, which goes hand in hand with the enormous AA traded volume in April (85% of posted).
TRACE Volumes & Dealer’s inventory
TRACE volumes have fallen slightly from last month, despite the increase in BWIC volumes. This brings the percentage of BWICs vs total TRACE reported volume to 23%, highest in last twelve months. Daily TRACE shows 3 days with volumes over $1BN, with over of the days experience oversized HY/equity flows. On the dealer inventory side, April brings back dealer buying, with clients selling $172MM.
“Lower percentage of DNTs up the stack makes sense. It’s an easier price discovery there, and market participants don’t have to be guessing.” — Eddy Piedra.
Prices Across the Stack
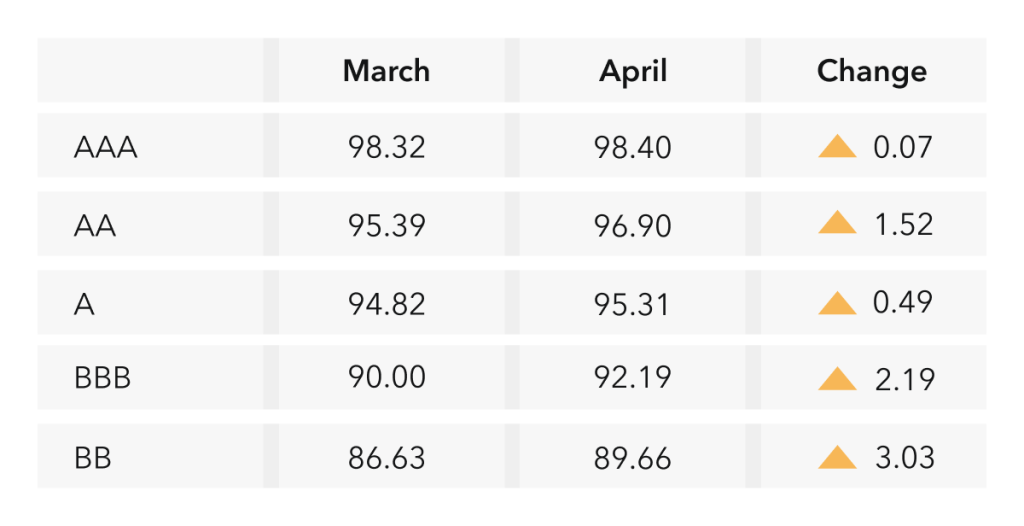
April average prices are close to LTM highs, with AAA trading at 98.4 cents on a dollar. Worth to note that previous LTM highs were in April 2022, but this month they rolled out to February 2023 (for BB, LTM highs are still in May 2022). This suggests that, even though the market is improving from last year’s price drop, the average prices are still worse than a year ago.
Comparing the first and last weeks of the month, AAA noticeably improved from 97.6 to 99.1.
New Issue
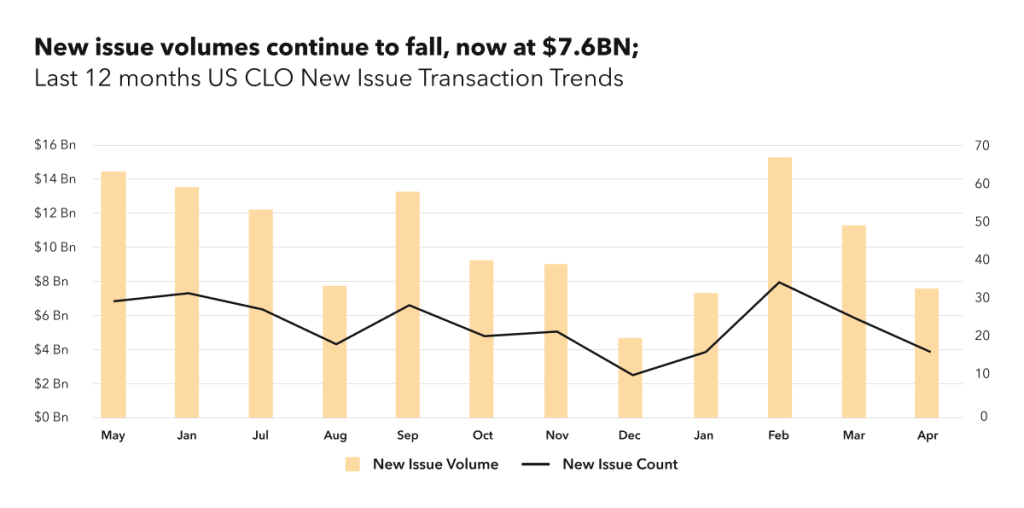
New issue volumes fell to $7.6BN, lower than LTM average of $10.5BN. Only 12% of April volumes are short deals, with 0-1.5 years non-call period and 0-3.5 years reinvestment period pointing to the fact that the market does not expect near-term rally in loans. US AAA spreads for longer BSL transactions are at 180-225 bps.
“CLO arbitrage was relatively unattractive until the second half of April, when DMs on liabilities started to tighten while loans prices remained relatively unchanged in the market.” — Eddy Piedra
Sign Up for Our Platform
Get up to the minute data on CLO new issue and secondary BWIC trading by signing up at bwic.kopentech.com.
Please join us on June 8th for Market Trends Webinar and register here.
KopenTech is affiliated with KopenTech Capital Markets, a member of FINRA.