When is the Best Day to Hold a CLO BWIC?

The standard BWIC process is inherently inefficient; it requires humans to communicate frequently during a narrow window of time and with limited price transparency. The more human involvement there is in any process, the more potential there is for biases and errors to occur. While KopenTech offers technology solutions to the human-centric process, we also offer some factors that sellers might want to optimize.
In this piece, we investigate an incredibly simple yet surprisingly persistent behavioral effect over which the seller has one hundred percent control: the day on which he/she holds the BWIC.
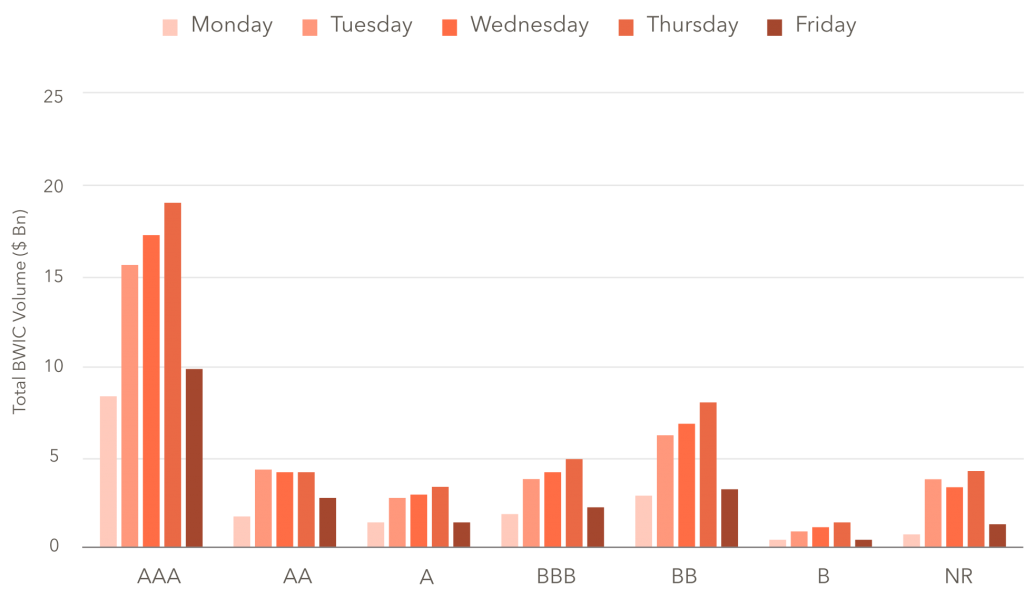
Total CLO BWIC Volume by Weekday, 6/2014 – 7/2020
Source: KopenTech
We begin by examining differences in CLO BWIC volumes by weekday. Using a sample from June 2014 through July 2020, we find that BWIC activity overwhelmingly takes place between Tuesday and Thursday. While this result may seem obvious given that many US holidays fall on Mondays and long weekends begin on Fridays, the striking difference in activity cannot be explained by a few holidays a year.
In the sample timeframe, Tuesdays, Wednesdays, and Thursdays saw respective BWIC volumes of $38 Bn, $40 Bn, and $45 Bn. While Mondays and Fridays saw respective volumes of $17 Bn and $21 Bn, roughly 50% less than other weekdays. Furthermore, the effect appears to be robust across ratings, as Monday and Friday are consistently the lowest volume days across the capital stack.
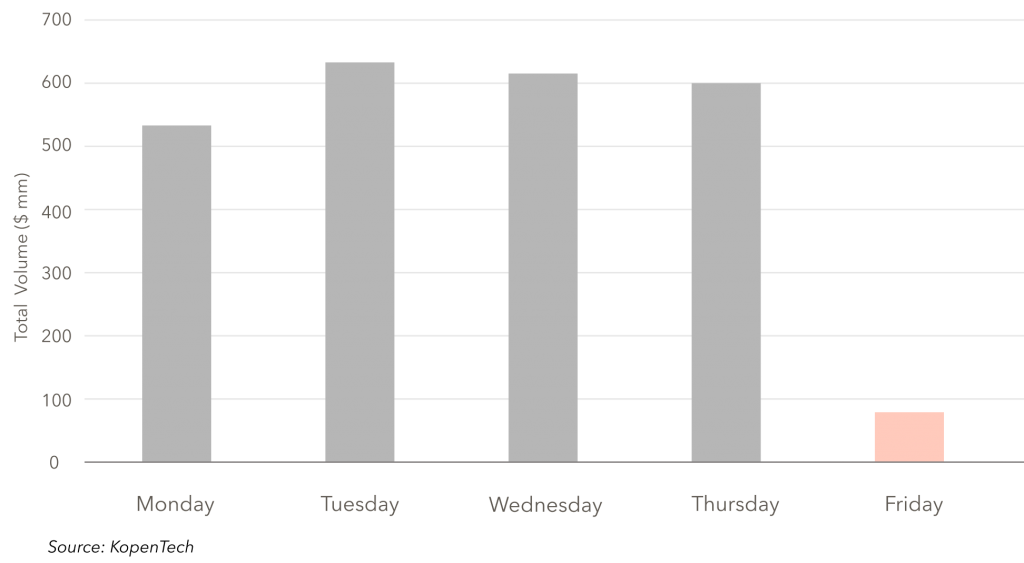
We hypothesize that this trend is due to sellers deciding not to commit to such an involved trading process on Mondays and Fridays, which are popularly seen as the “worst” and “best” days of the week. So, it is possible that sellers simply prefer not to trade on Mondays and Fridays. If this is the case, and it is partially driven by vacation plans and long weekends, then we would expect the divide to be even starker during summer months. So, as an entertaining experiment, we take all trading days from July 6-31, 2020 (to avoid July 4th and provide 4 full weeks of data) and see if the same effect can be observed.
BWIC Trade Volumes by Day of the Week, July 6-31
Source: KopenTech
Although Mondays exhibited only a slightly lower volume in the July sample, Fridays saw a tremendous 85% decrease in volume compared to all other weekdays. So, it seems that our theory of sellers taking Fridays easy may hold some water.
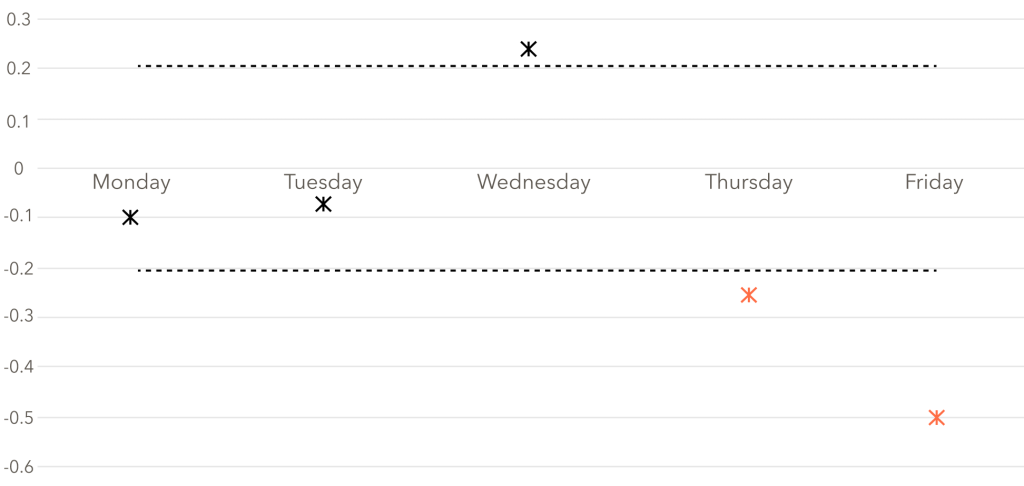
However, the initial question we asked is how can a BWIC seller optimize outcomes based on this information. To find an answer, we take a third sample, this time from 2016-2019 to have several years of complete data. We retrieved discount margins (under a constant scenario) for all trades in the period which provided color, and then we created ‘Execution Scores’ from these DMs by normalizing them against tranche rating and market performance in that month to account for time trends. We took the average Execution Score for each weekday to see if a pattern emerged. If the Execution Score is below zero, it implies that DMs on that weekday are generally tighter than average, and vice versa. If the mean score was above 0.2 or below -0.2 for any day, it means that the result is significant at the 95% level.
Execution Scores by Day of the Week, 2016-2019
It appears that Monday and Tuesday are neutral days, Wednesday has wider DMs on average, and Thursday and Friday have tighter DMs on average. Wednesday and Thursday hardly surpass the significance threshold, so we will focus on Friday, the most significant day with a score of -0.49. This score means that DMs generally trade much tighter than average on Fridays, indicating a sellers’ market since tighter DMs means higher risk-adjusted prices. One hypothesis as to why this occurs is that because of the incredibly low volume on Fridays, the market is less saturated with sellers and thus allows more leverage to the sellers on that day. If we assume that broker-dealers, who are usually client-constrained participants, are sitting diligently at their desks on Friday so they do not miss a chance to submit client bids, then we have a situation where the supply of CLOs has decreased for this day, but the demand has remained more or less constant. In economic terms, this scenario is referred to as a shortage, which drives up prices in the short term. This phenomenon seems to occur on Fridays in the CLO secondary microcosm. Thursday, on the other hand, breaks the trend by having high volume but a low execution score. So, while this explanation may not be strictly correct across all observations, the evidence and theory both point to Friday being the best day to hold a BWIC.
It is troubling to see that volume can negatively influence prices. This seems to imply that current secondary CLO market trading is limited by the size of the secondary desks servicing it. The technology could efficiently process larger volumes, as it does in many asset classes and structures. With KopenTech BWIC, we hope to make the market for trading CLOs more efficient and time-effective so that trading on a Friday is no longer a headache. We invite you to explore our trading tools at bwic.kopentech.com.
Together we can build a better marketplace.


