CLO Secondary Market Trends: August 2021 Edition
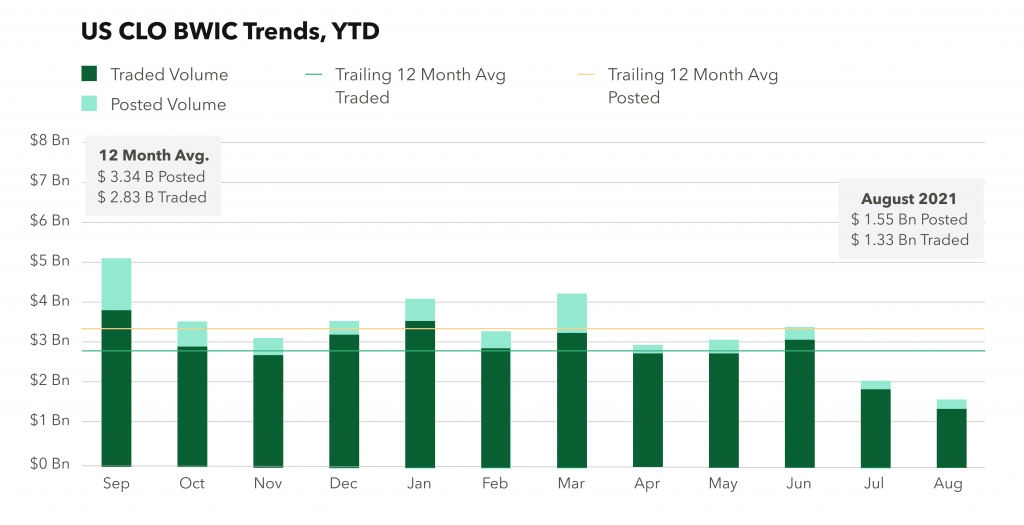
BWIC Volumes
August BWIC volumes dropped significantly in comparison to July. Posted and traded volumes were $1.55 Bn and $1.33 Bn, respectively. The trend of high ratio of successful BWICs continued in August.
TRACE* Volumes
Reported CLO trading volumes were $8.5 Bn in August, up $500 mm from July. The small gain resulted from the increase in the IG-rated trading volume.
BWICs as % of TRACE
Over the last 5 years, BWICs have been roughly 1/3 of the TRACE reported meaning the other 70% is out of comp. IG and non-IG TRACE BWICs dropped to TTM lows at 20% and 10% respectively.
BWIC Volumes By Rating
In August, AAA volumes saw only 30% of the TTM average with $520 mm sold via BWIC. Similar drops were seen across the stack, including equity which traded $90 mm over BWIC compared to a TTM average of $130 mm per month.
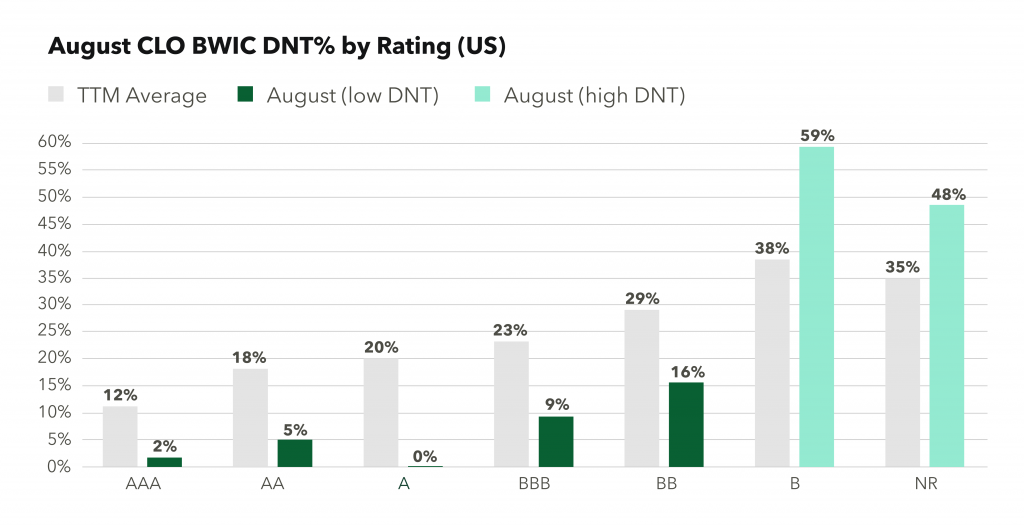
DNT Rates
IG CLOs continued to show strong demand with 98% of AAA BWICs trading and 100% of A also trading. However, we saw a reversal in B and CCC bonds and CLO equity which had higher than average DNT rates with 59% and 48% respectively.
Dealers Inventory
In August, dealer desks were net sellers of bonds with $275 mm of outflows. The prior 2 months saw more muted activity with a net outflow of $15 mm in June and $103 mm of net purchases in July.
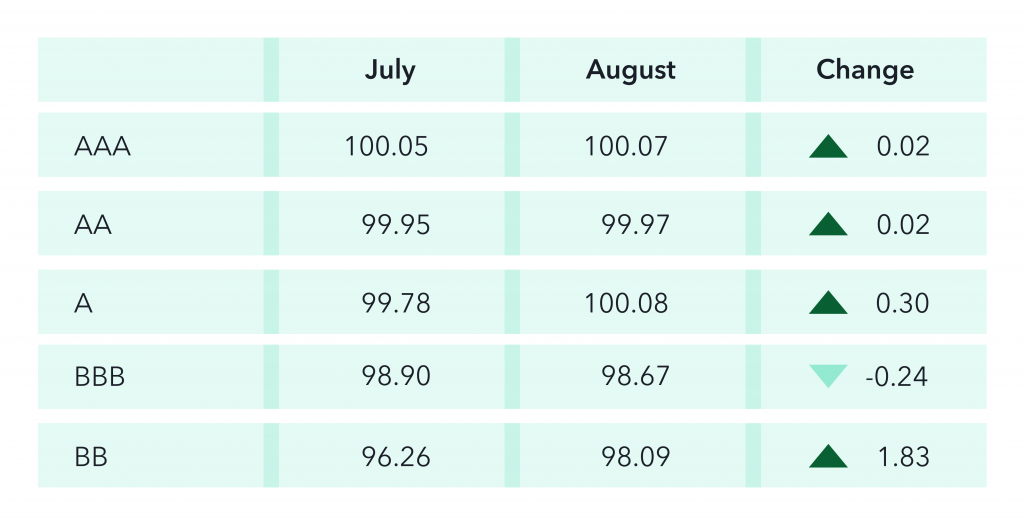
Prices** Across the Stack
AAA and AA prices remained consistent from July. BB saw the largest change, increasing by 1.83.
CLO Equity IRRs
The last few months have seen increased volume of CLO equity traded via BWIC. KopenTech analysts investigated the expected IRR of CLO equity that traded with public color given, utilizing standard industry assumptions across a total of 9 data points in August. The resultant expected IRR was 11.77%.
*TRACE reports all CLO trades involving FINRA members.
**Prices are based on trades that provided color and are likely to underestimate actual traded levels.