AMR in the Secondary Market

Applicable Margin Reset (AMR) is beginning to gain broad acceptance in the CLO market, especially since the coronavirus pandemic has led to widened spreads in the CLO primary pipeline. The feature, which is designed to make the refinancing process quicker and more cost-effective, has been adopted by nine CLOs to date, for a total of just under $5 B in issuance.
Now that the first deals with AMR embedded have been in the market for a few years, investors are curious about how they have fared in secondary trading versus non-AMR deals. Initial results suggest that AMR does not negatively impact a CLO’s secondary market liquidity: in fact, it may even increase it.
To investigate how the broader market views AMR CLO tranches, we conducted a study of BWIC trades in 2020. The trades ranged from 1 January through 16 July. The sample of all AMR CLOs printed before 2020 was compared to all CLOs outstanding in the market.
For the sample of AMR CLOs, the following deals were included:
- Trimaran Advisors’ Catamaran CLO 2014-1 (Reset)
- Crescent Capital’s Atlas Senior Secured Loan Fund VIII
- Seix’s Mountain View CLO 2017-2
- Seix’s Mountain View CLO XIV (non-AMR classes E and F excluded)
- TCW’s TCW CLO 2019-1 AMR
- Neuberger Berman’s Neuberger Berman Loan Advisers CLO 34
(classes A-1, B-1, and E excluded) - East-West Investment Management’s East-West Investment Management CLO 2019-1
This sample is comprised of only AAA-BB tranches and adds up to $2.6bn in
outstanding principal value.
To create a comparable figure for the broader market, we begin with the latest CLO outstanding figure from SIFMA which was roughly $606bn in Q1 2019. Subtracting the $2.6bn of AMR tranches and taking away 12% to account for equity, Single B, and untradable tranches, we arrive at an estimated figure of $532bn in outstanding AAA-BB Non-AMR CLO tranches.
Our timeline starts in January 2020 to ensure that all 2019 AMR issues were free to trade throughout the timeframe. To estimate the annualized BWIC “turnover rates” for AMR and non-AMR CLOs, we take the total traded volume of each, divide by the respective estimated outstanding balances, and normalize the figures to a 12-month time frame.
Annualised BWIC turnover rates (AAA-BB Only)
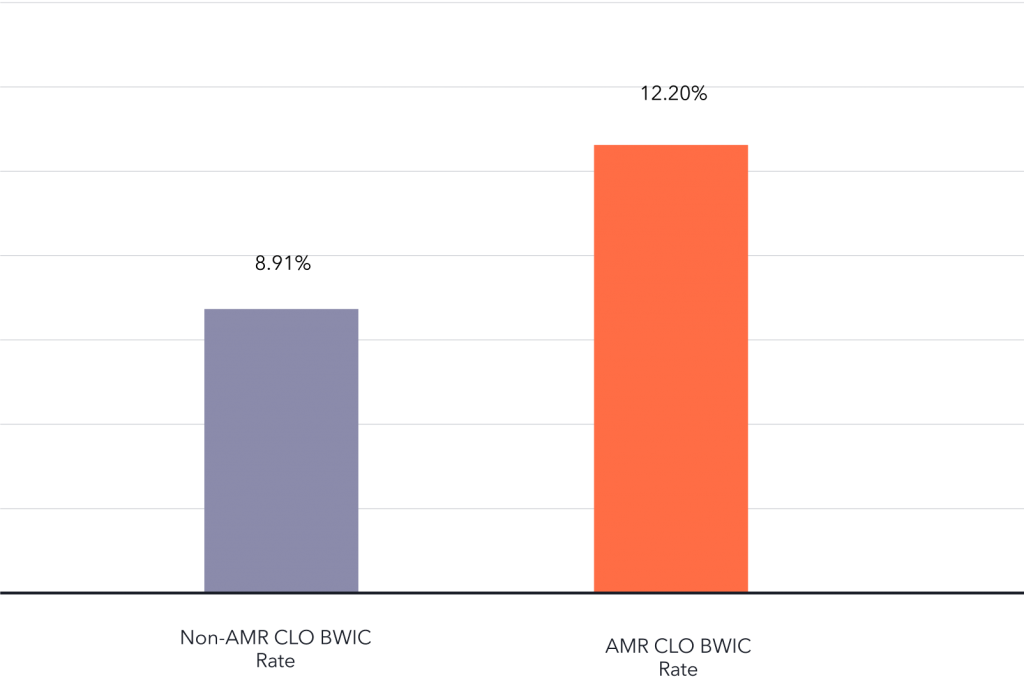
The figures show that AMR CLOs traded via BWICs at an annualized rate of 12.2% of outstanding value versus 8.9% for Non-AMR CLOs, implying sufficient, if not higher, demand for AMR CLOs in the secondary market.
However, the volume only tells half the story. Next, we looked at traded prices to see if there were any disparities between the two samples.
Price information in BWICs can be gleaned through two channels: pre-trade price talk (“px talk”) where broker-dealers submit expectations of traded prices, and post-trade color, which is optional dissemination of the best or cover (second best) price provided by the seller.
Post-trade color (usually second-highest bid level) was available for 45% of non-AMR trades and 40% of AMR trades. To increase the number of data points, we used the average px talk from all dealers when color was not available. (Although px talk is usually an unreliable predictor of color on an individual level, it serves well across a broad sample: in the subsample of trades where post-trade color was provided, substituting the average px talk across dealers for each BWIC yields an average error of only 0.03.)
To infer the average market levels for both AMR and non-AMR CLOs, we used the same 2020 BWIC sample and take the average color (or inferred color) levels across each rating from AAA through BBB notes. (There was not enough price information given for BB tranches from AMR CLOs, so this data was excluded). The data appears to show that AMR tranches trade at similar, or marginally better, levels throughout the CLO capital structure:
Avg Observed Traded BWIC Color/Px Talk Levels
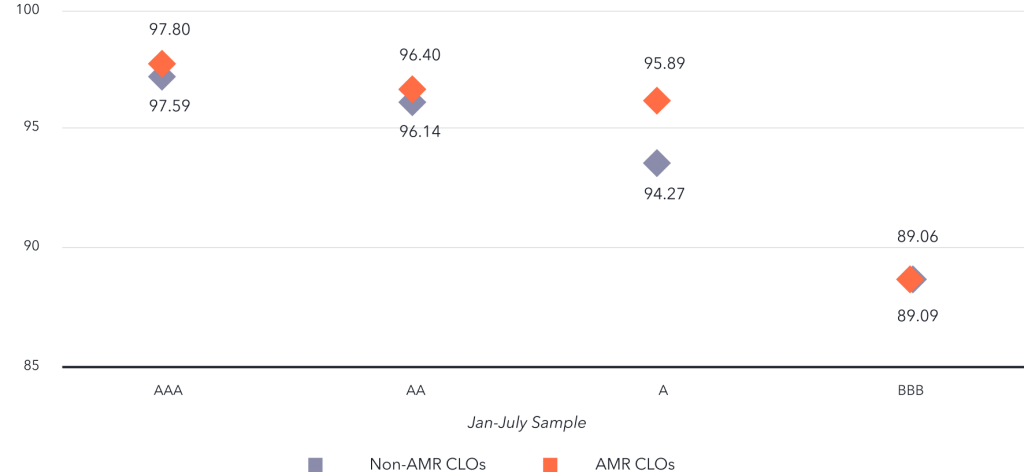
Now, we see that AMR tranches have traded both more frequently and at higher levels than non-AMR CLOs in 2020. What does this tell us about investor demand for AMR deals? For starters, it appears that on the whole, debt investors are clearly not averse to the feature.
Obviously, price levels are driven by many factors other than AMR, such as
non-call/reinvestment length, manager quality, market value over-collateralization, etc.
However, the sample of AMR deals is diverse: it includes vintages dating back to 2017, a reset of a 2014 vintage, and one repeat manager (Seix). Given this diversity, and the fact that we are looking at longer averages rather than comparing on a tranche-by-tranche basis, price comparisons are valid for the purposes of this study.
It makes sense that debt investors may be indifferent to the feature, but why would demand be higher than that for non-AMR CLOs?
One explanation is that because AMR implies an earlier expected maturity for debtholders due to increased call probability, debt investors may prefer deals with AMR embedded during volatile times to reduce duration risk. However, a much larger sample is needed to confirm such a claim; there were only 38 AMR CLO trades in the current sample compared to over 7,000 Non-AMR CLO trades. As time goes on, better data will lead to more clarity on this issue.
One thing that is certain about AMR is that in times of widening new issue spreads, the feature becomes especially attractive to CLO managers. Two managers chose to embed this feature in their deals this July, likely due to the feeling that a future refinancing is nearly inevitable in this widened out the market. And with early secondary trading data seeming to confirm either debt investor attraction or indifference to the feature, AMR may find its way into an increasing number of deals.