CLO Secondary Market Trends: August 2020 Edition
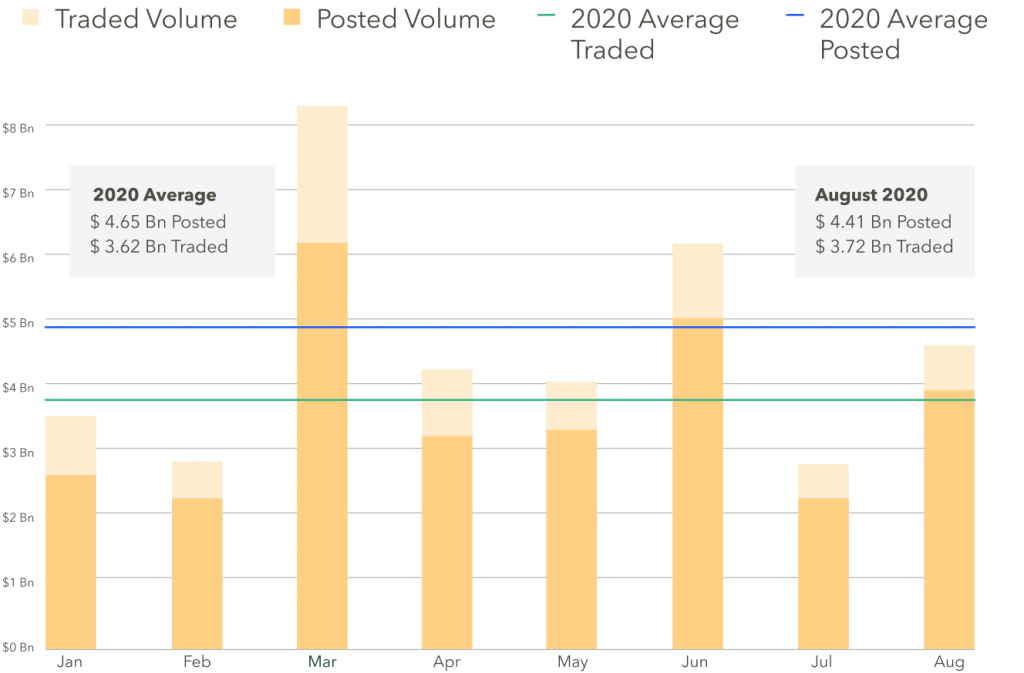
BWIC Volumes:
August had the third-largest monthly BWIC volume in 2020, 33% higher than July’s.
US CLO BWIC Trends, 2020:
TRACE Volumes:
TRACE reports all CLO trades involving FINRA members, including those done outside of BWICs. TRACE data confirm August CLO trading activity was the third highest of 2020, with $16.6 Bn traded, up $3.8 Bn from July.
Dealers were neutral in August, selling the only net $6 mm in CLOs
August’s $6 mm negative net flow of bonds shows a cooldown compared to July’s $651 mm dealer selloff. The neutrality observed in August may be due to dealers slowing down inventory sales amidst an extended rally. Alternatively, dealers may have simply balanced the books in July to prepare for August vacations.
BWIC Volumes by Tranche: High AAA paper dominates trading
AAA volumes were much higher than 2020’s average. Equity barely traded at all. Both are a sharp contrast to July.
Pro Tip: Access over 6 years of historical CLO secondary data on our platform
Average AAA trade size is up $1.66 mm over 2020 $5.56 mm average
August saw some large AAA trades: three $50 mm positions in one day, and 30 trades in excess of $25 mm.
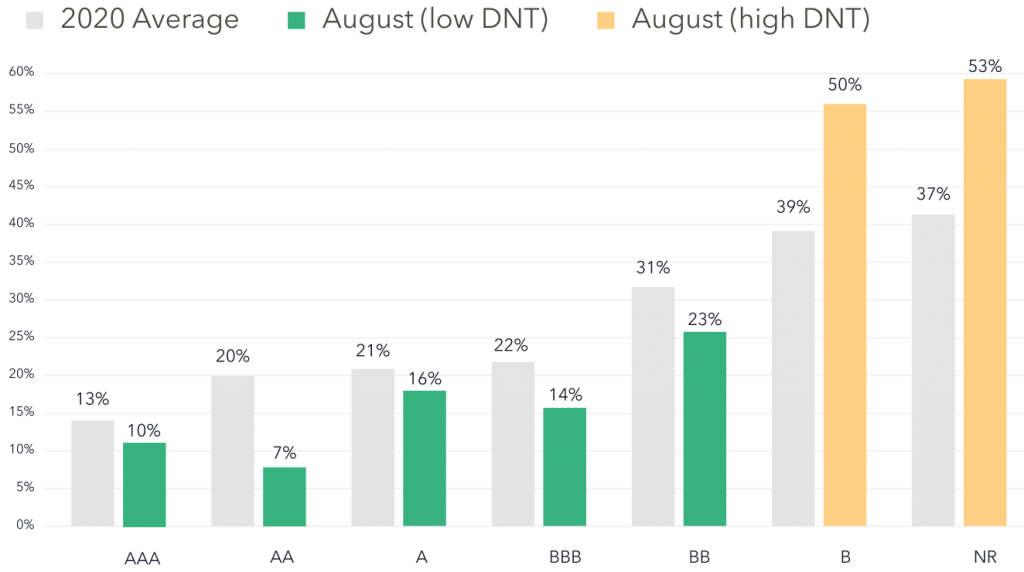
DNT Rates
DNT rates can proxy for demand. Lower DNT rates indicate higher demand. We saw lower rates across the IG stack, and a significant increase across Bs and equity.
August CLO BWIC DNT% by Rating (US)
Trade of the month
The largest trade in August was MJX’s Venture XX CLO, with a $63 mm original notional ($49 mm actual) piece of its AAA tranche.
CLO prices* rise, except BBs
IG prices rose significantly, single As lead the way with a 3.27 point move upwards. BB prices saw a 1.45 point drop.
Buyers find best levels on Wednesday; sellers – on Fridays
Historical data between 2016-2019 indicate that the day of the week influences trade levels because of volume over/underloads. Wednesday has the highest volume posted by sellers on average, and it also turns out to be the best day for buyers to achieve the widest spreads. Conversely, Fridays saw the lowest average volume along with the tightest spreads.
Higher volume correlated with higher DNT rates
In a well-functioning market, there should be no correlation between volumes and DNT rates. When there is a lot of volumes, individual BWICs don’t get enough attention and DNT. Electronic trading makes the process faster, more accessible and improves execution. DNTs due to capacity overload is likely to become a matter of the past.
*Prices are based trades that provided color (usually second highest bid) and are likely to underestimate actual traded levels