CLO Secondary Market Trends: October 2020 Edition
BWIC Volumes:
October is the first month since July to see a decrease in BWIC volumes.
US CLO BWIC Trends, 2020:
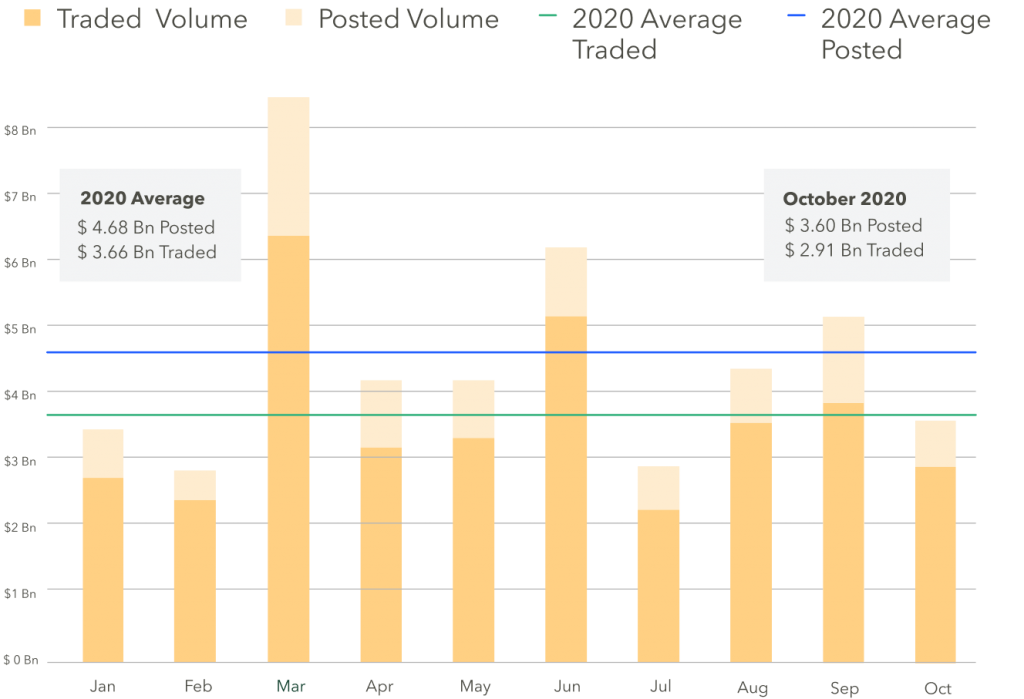
TRACE Volumes
TRACE reports all CLO trades involving FINRA members, including those done outside of BWICs. TRACE data reports that the October CLO trading activity was the lowest of 2020, with $11.9 Bn traded.
Positive dealer flow trend continues in October
October saw a positive net dealer flow of $196 mm. Historically, this correlates with a stronger market. This was not true in October when credit had a large selloff across the board, possibly due to the pre-election risk-off trade. Banks increasing their balance sheets indicates the expectation for a year-end rally.
BWIC Volumes by Tranche
AAA volumes matched the 2020 monthly average at $1.84 Bn traded. All the other tranches experienced substantially lower-than-average BWIC listings, particularly the BBB and BB stack which were both down over 50%.
Pro Tip: Create a watchlist, receive notifications when opportunities appear.
Average Trade sizes down for all rated tranches, equity slightly up
This month was characterized by smaller trade sizes for rated tranches. The average equity trade size was slightly larger than the 2020’s average, but with only 15 equity tranches traded.
DNT Rates
We look to DNT% as a proxy for demand. AAA bonds were in high demand, while lower-tier bonds and equity demand was weak. Risk-off sentiment and falling prices could be to blame for decreased demand.
Trade of the month
The largest trade on BWIC in October was a Madison Park 23 CLO by CSAM which had a $47 mm position change hands.
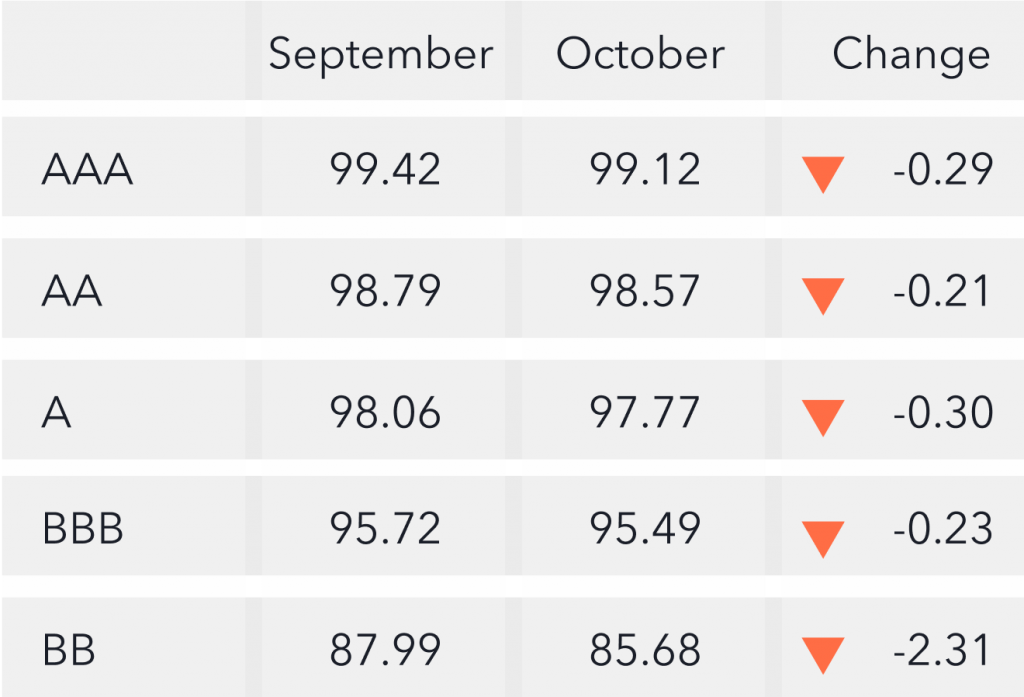
Prices* down across the stack
Color is a proxy for actual traded prices. From September to October we saw average prices decline by a quarter-point, with the exception of BBs which were the biggest decliners with a 2.31-point price decrease.
Liquidity outlook
When the market is stressed, dislocations and liquidity premia emerge, and price talk accuracy, gets reduced. In October we saw liquidity health measures improve. Price color provided for trades increased by 5% and AAA average price talk deviation from traded level was at its lowest since February. As we look back at the year, these metrics were fairly stable in January and February before the major liquidity crisis hit in March and continued throughout April and May. It wasn’t until July that we started to see metrics somewhat closer to what we saw pre-Covid.
Pro Tip: Track liquidity measures on KopenTech’s dashboard daily.
*Prices are based on trades that provided color (usually second-highest bid) and are likely to underestimate actual traded levels